February market stats were published by the NWMLS yesterday. Before we get into our monthly stats, let’s have a look at their press release.
Early Spring Brings Bumper Crop of Homebuyers Who Face Inventory Drought
Favorable weather and restored confidence are propelling home buying activity around Western Washington to the highest level in nearly a decade, according to Northwest Multiple Listing Service sources.
“The pent-up demand being unleashed has rocketed pending sales back to the levels of our record year in 2006,” said Ken Anderson, president/designated broker at Coldwell Banker Evergreen Olympic Realty in Tumwater. Buyers have come off the sidelines, the former MLS director commented, adding “At the same time, homes for sale are near a 10-year low.”
The language in these releases is getting more and more over-the-top and reminiscent of the kind of thing we used to see 2005-2007. Describing sales as “rocketing” reminds me of the 2006 classic “last spaceship flight off a planet that’s about to explode.“
NWMLS monthly reports include an undisclosed and varying number of
sales from previous months in their pending and closed sales statistics.
Here’s your King County SFH summary, with the arrows to show whether the year-over-year direction of each indicator is favorable or unfavorable news for buyers and sellers (green = favorable, red = unfavorable):
| February 2014 | Number | MOM | YOY | Buyers | Sellers |
|---|---|---|---|---|---|
| Active Listings | 2,721 | +1.5% | -14.2% |  |
 |
| Closed Sales | 1,383 | +3.2% | +11.4% |  |
 |
| SAAS (?) | 1.36 | +32.4% | -2.3% |  |
 |
| Pending Sales | 2,485 | +16.1% | +15.4% |  |
 |
| Months of Supply | 1.97 | -1.7% | -23.1% |  |
 |
| Median Price* | $429,900 | -2.6% | +6.0% |  |
 |
Feel free to download the updated Seattle Bubble Spreadsheet (Excel 2003 format), but keep in mind the caution above.
Unfortunately for buyers, the same trend we’ve been seeing for the last year continued uninterrupted in February. Very few listings and plenty of buyers. Prices
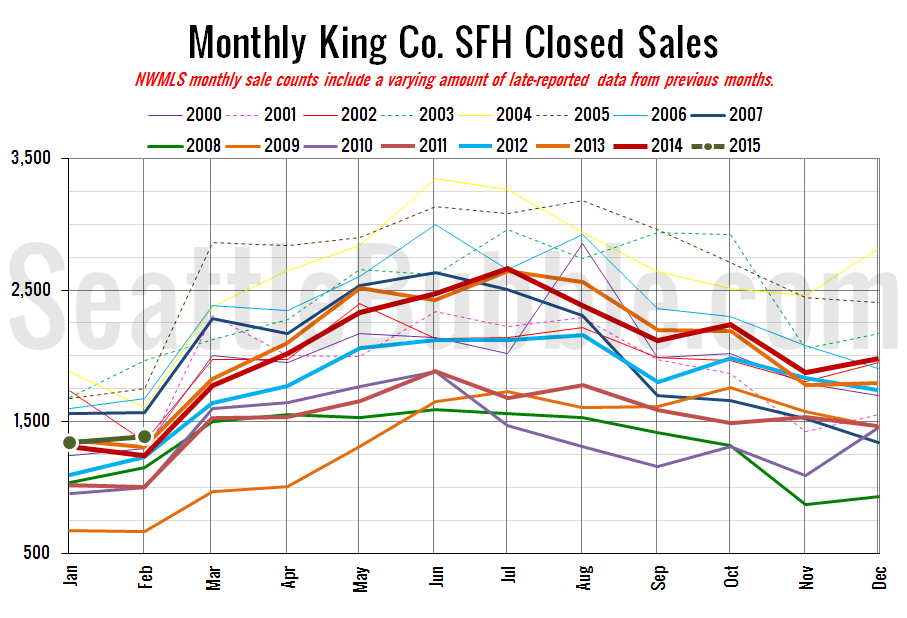
Here’s your closed sales yearly comparison chart:
Closed sales rose 3 percent from January to February. Last year they fell 5 percent over the same period, so it looks like sales are getting a slightly early start this year.
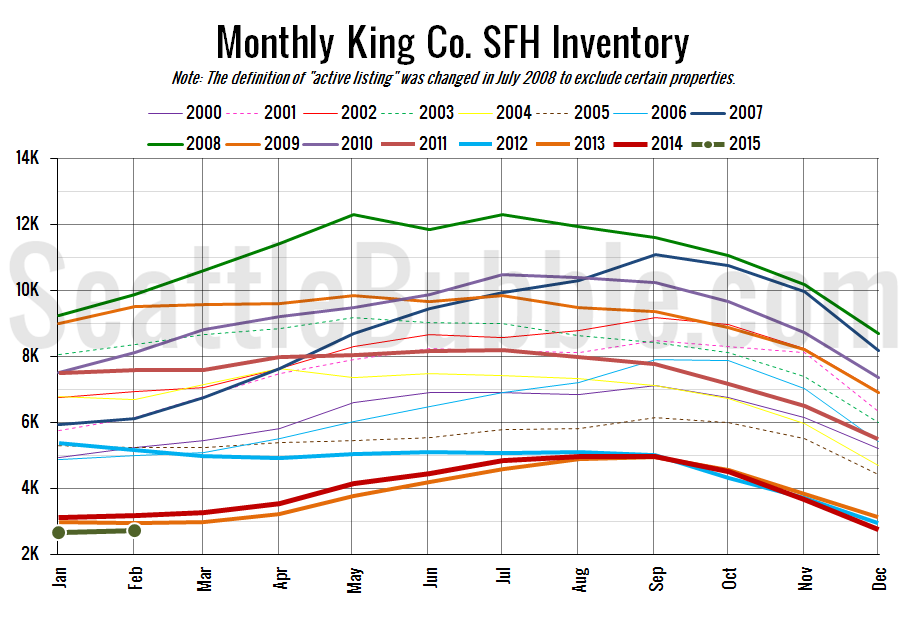
Here’s the graph of inventory with each year overlaid on the same chart.
Thankfully for buyers, inventory rose slightly in February from the all-time low point set in January. Unfortunately it wasn’t much of an increase. Also worth noting: The 2,721 new listings that hit the market in February was only barely more than the 2,485 listings that went off the market to pending status in the same month.
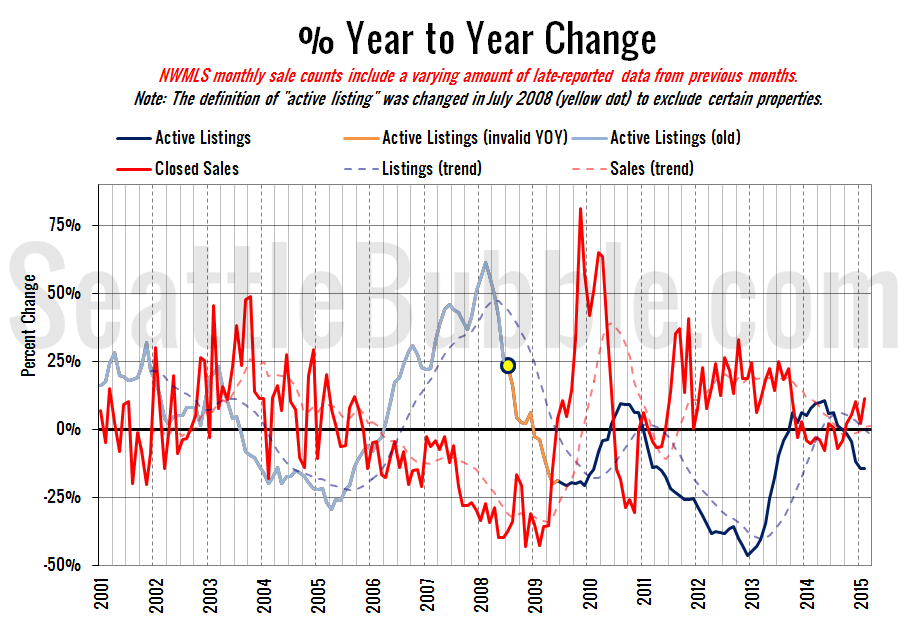
Here’s the supply/demand YOY graph. “Demand” in this chart is represented by closed sales, which have had a consistent definition throughout the decade (unlike pending sales from NWMLS).
Both supply and demand continued to move further in sellers’ favor in February.
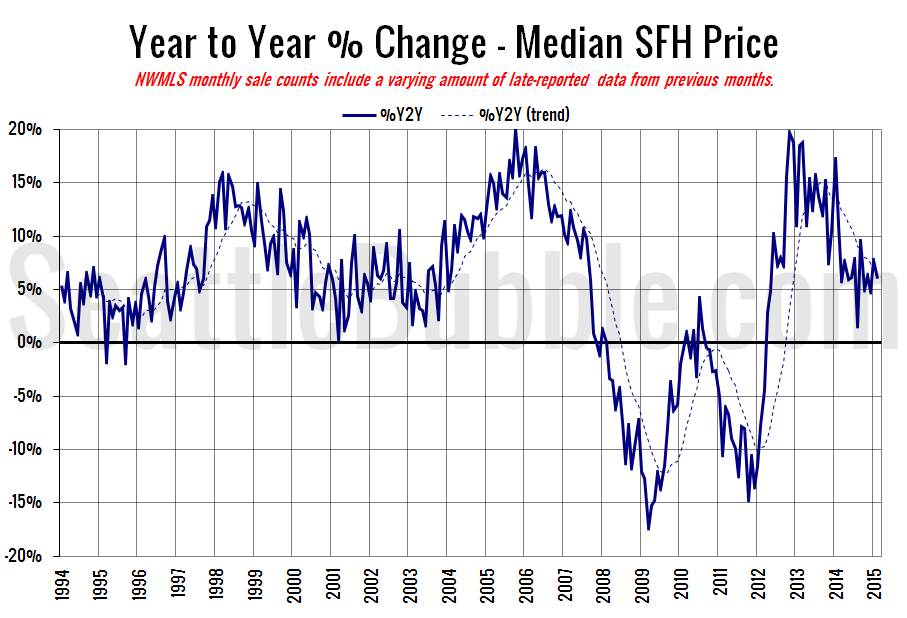
Here’s the median home price YOY change graph:
Down slightly from last month, but still in a range that historically represents a very strong market.
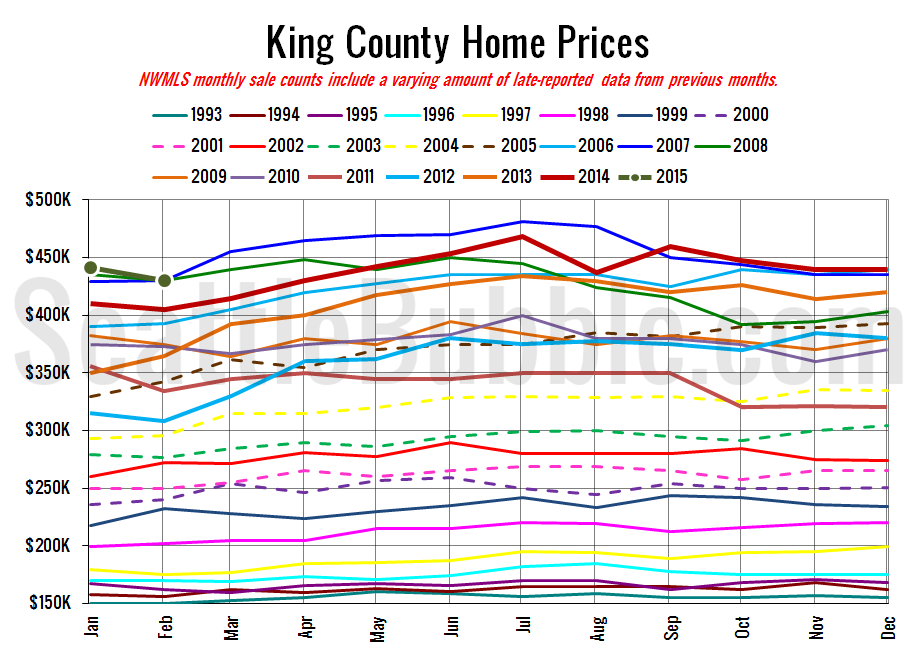
And lastly, here is the chart comparing King County SFH prices each month for every year back to 1994 (not adjusted for inflation).
Home prices dropped to their lowest point in 11 months, but don’t expect the trend to continue as we head into the spring with so few homes and demand so high.
January 2015: $429,900
May 2006: $427,950
Here’s this month’s articles from the Seattle Times. I couldn’t find any article on the P-I, perhaps Aubrey Cohen is on vacation.
Seattle Times: King County home prices up 6% from a year ago
Check back on Monday for the full reporting roundup.
