April market stats were published by the NWMLS yesterday. Before we get into our monthly stats, here’s a quick look at their press release.
Pent-up demand triggering record pace of home sales around Western Washington
Northwest Multiple Listing Service members notched a record high level of pending sales during April, surpassing the year-ago volume by nearly 1,800 transactions. Both closed sales and prices also surged last month as the spring market kicked into high gear.
Buyer confidence and buyer ability to purchase are fueling activity, suggested Ken Anderson, the managing broker and owner of Coldwell Banker Evergreen Olympia Realty. “Long building pent-up demand is being unleashed,” he commented.
…
Closed sales and prices also accelerated, according to Northwest MLS statistics. Across the 23 counties covered by the report there were 7,696 closed sales. That total represents a 24.3 percent increase from the year-ago volume of 6,190 closings. Within the four county region, Pierce County experienced a jump of nearly 38 percent in closed sales compared to a year ago, followed by Snohomish County with a 35 percent increase, prompting one MLS director to comment, “That is super amazing.”
You can almost hear the home salespeople high-fiving each other from here.
NWMLS monthly reports include an undisclosed and varying number of
sales from previous months in their pending and closed sales statistics.
Here’s your King County SFH summary, with the arrows to show whether the year-over-year direction of each indicator is favorable or unfavorable news for buyers and sellers (green = favorable, red = unfavorable):
| April 2014 | Number | MOM | YOY | Buyers | Sellers |
|---|---|---|---|---|---|
| Active Listings | 3,003 | +9.7% | -15.2% |  |
 |
| Closed Sales | 2,352 | +12.5% | +16.7% |  |
 |
| SAAS (?) | 1.37 | +4.7% | -5.9% |  |
 |
| Pending Sales | 3,410 | +5.5% | +14.4% |  |
 |
| Months of Supply | 1.28 | -2.5% | -27.3% |  |
 |
| Median Price* | $480,000 | +9.0% | +11.5% |  |
 |
Feel free to download the updated Seattle Bubble Spreadsheet (Excel 2003 format), but keep in mind the caution above.
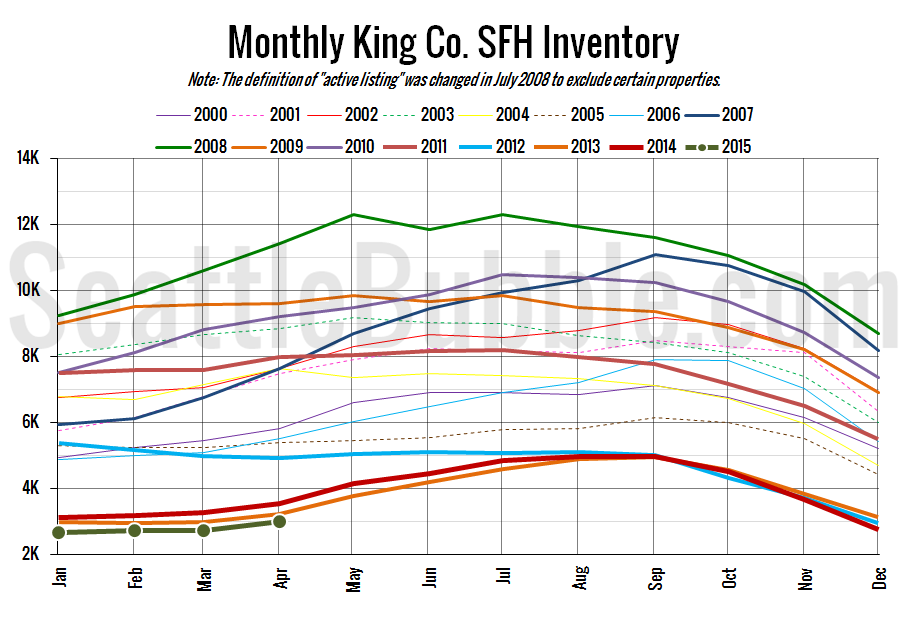
Unfortunately for buyers, there’s still no good news on supply. Inventory is pitiful and shows no glimmer of getting any better soon. With inventory as low as it is and interest rates still so low, I’m actually surprised home prices are only up six percent from a year ago.
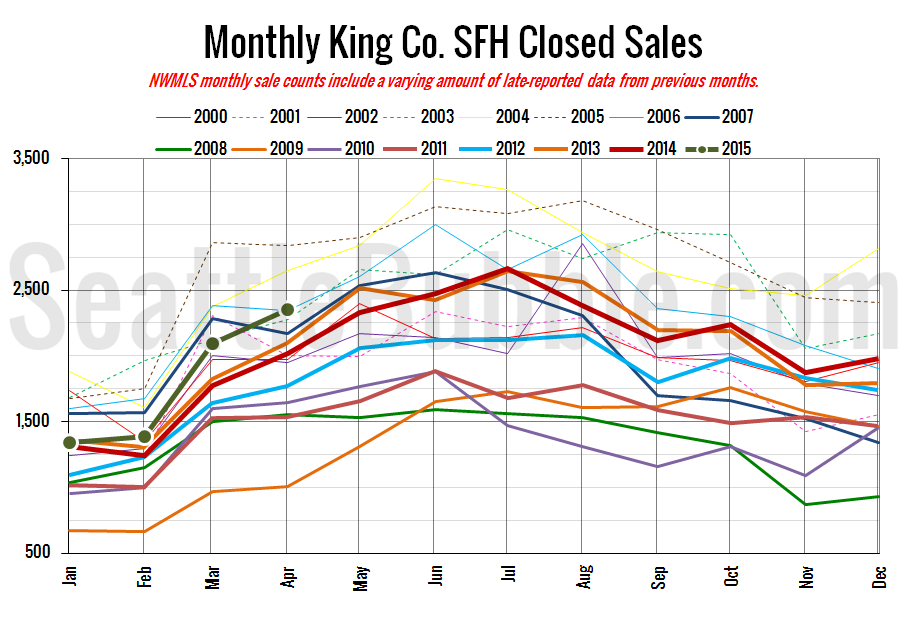
Here’s your closed sales yearly comparison chart:
Closed sales rose 12 percent from March to April. Last year they rose 14 percent over the same period.
Here’s the graph of inventory with each year overlaid on the same chart.
Inventory saw its biggest month-over-month increase since last May, up 10 percent from last month. However, year-over-year inventory is still down double digits, off 15 percent from a 2014.
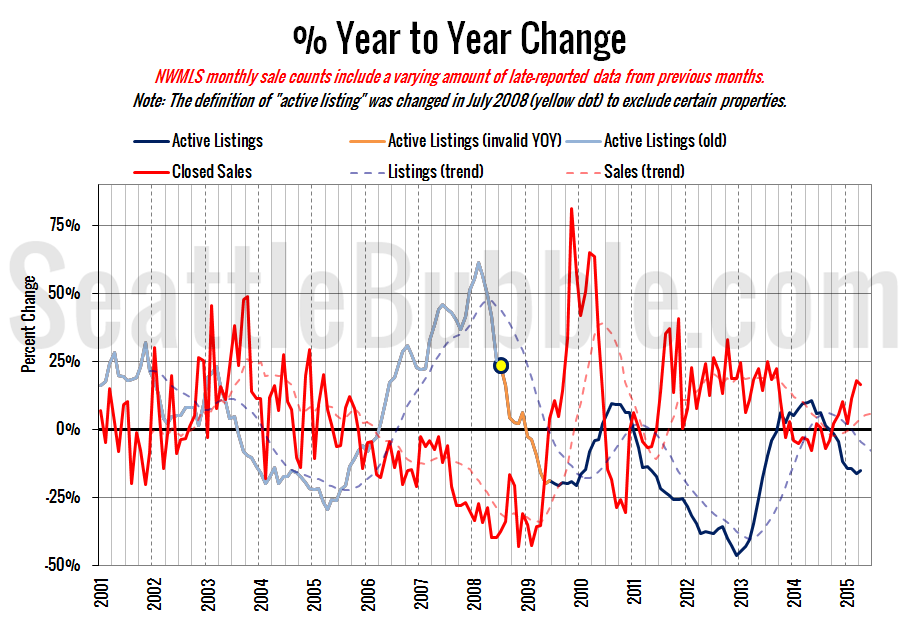
Here’s the supply/demand YOY graph. “Demand” in this chart is represented by closed sales, which have had a consistent definition throughout the decade (unlike pending sales from NWMLS).
Both supply and demand inched slightly back toward buyers’ favor in April, but remain well in seller’s market territory.
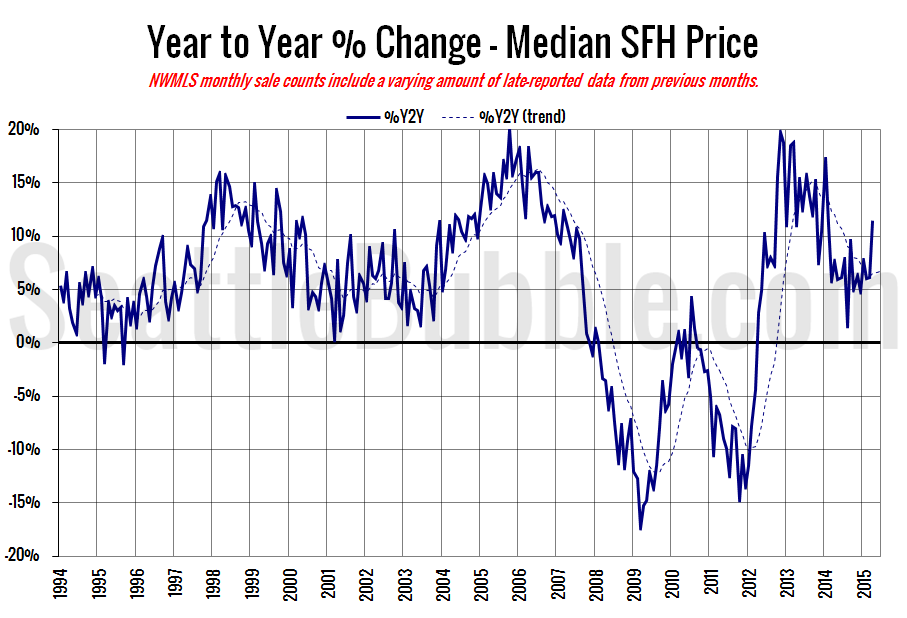
Here’s the median home price YOY change graph:
Last month I said that I was “frankly shocked that this chart isn’t in the double digits.” Well, now it is. Sorry, buyers.
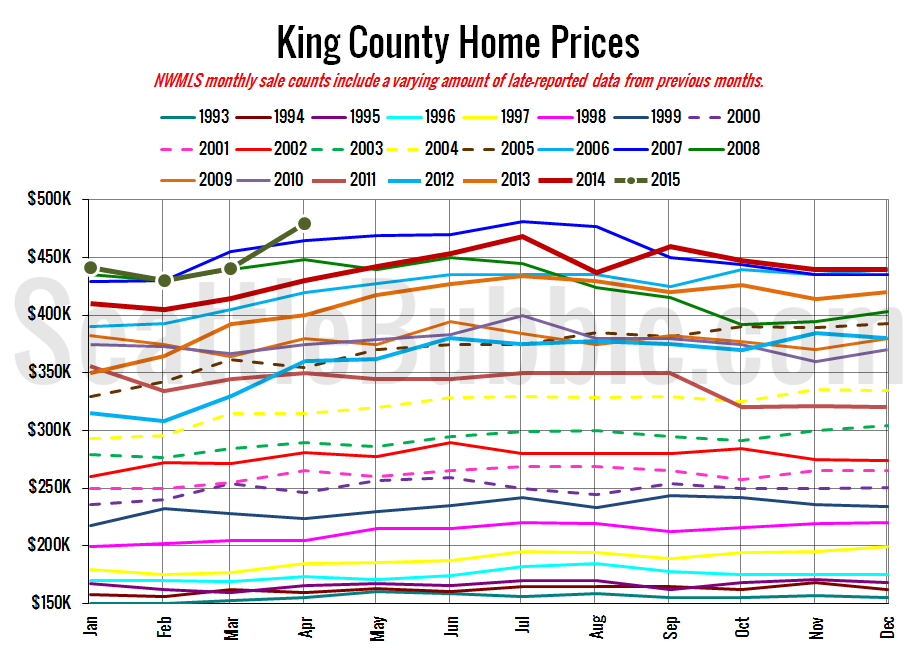
And lastly, here is the chart comparing King County SFH prices each month for every year back to 1994 (not adjusted for inflation).
The median home price shot up in April to just shy of the July 2007 peak. Remember that these values are not adjusted for inflation though. Maybe later this week I’ll post an inflation-adjusted version of this chart to see where we stand.
April 2015: $480,000
July 2007: $481,000
Here’s this month’s article from the Seattle Times: King County home prices surge, just shy of 2007 peak
Check back tomorrow for the full reporting roundup.
