It’s been a few months since we took a detailed look at foreclosure stats in King, Snohomish, and Pierce counties, so let’s update those numbers. First up, the Notice of Trustee Sale summary:
May 2015
King: 306 NTS, down 27% YOY
Snohomish: 162 NTS, down 18% YOY
Pierce: 279 NTS, down 14% YOY
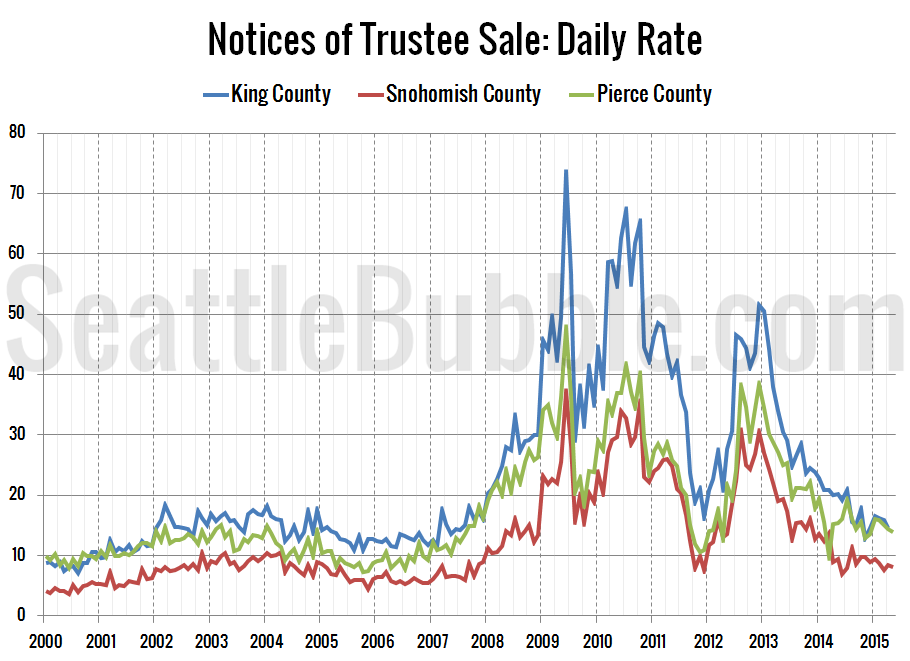
The number of trustee sale notices continues to fall. Here’s the chart of foreclosures per business day. All three counties are down month-over-month and year-over-year by that metric as well:

Here’s how the latest month’s weekday rate of foreclosures in each county compares to the 2000-2007 average and the highest level that was reached during the housing bust.
Daily Rate of Foreclosures
| County | Latest | YOY | ’00-’07 | Max |
|---|---|---|---|---|
| King | 14.6 | -27% | 13.4 | 73.4 |
| Snohomish | 8.1 | -14% | 7.0 | 37.1 |
| Pierce | 14.0 | -9% | 11.2 | 47.7 |
All three counties continue to drop double digits from last year’s levels.
Back in January I said that “2015 seems likely to be the year foreclosure levels return to their pre-bust levels.”
Here’s your interactive Tableau dashboard updated with the latest foreclosure data:
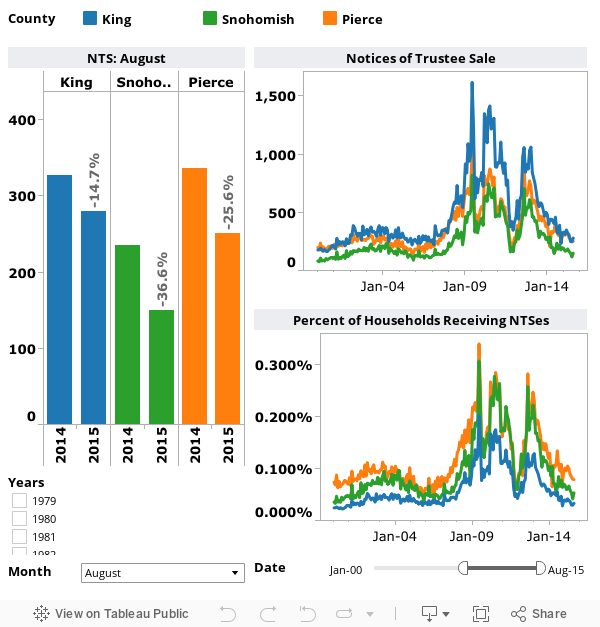
The percentage of households in the chart above is determined using OFM population estimates and household sizes from the 2000 Census. King County came in at 1 NTS per 2,742 households, Snohomish County had 1 NTS per 1,726 households, and Pierce had 1 NTS for every 1,140 households (higher is better).
According to foreclosure tracking company RealtyTrac, Washington’s statewide foreclosure rate for May of one foreclosure for every 1,232 housing units was 17th highest among the 50 states and the District of Columbia. Note that RealtyTrac’s definition of “in foreclosure” is much broader than what we are using, and includes Notice of Default, Lis Pendens, Notice of Trustee Sale, and Real Estate Owned.
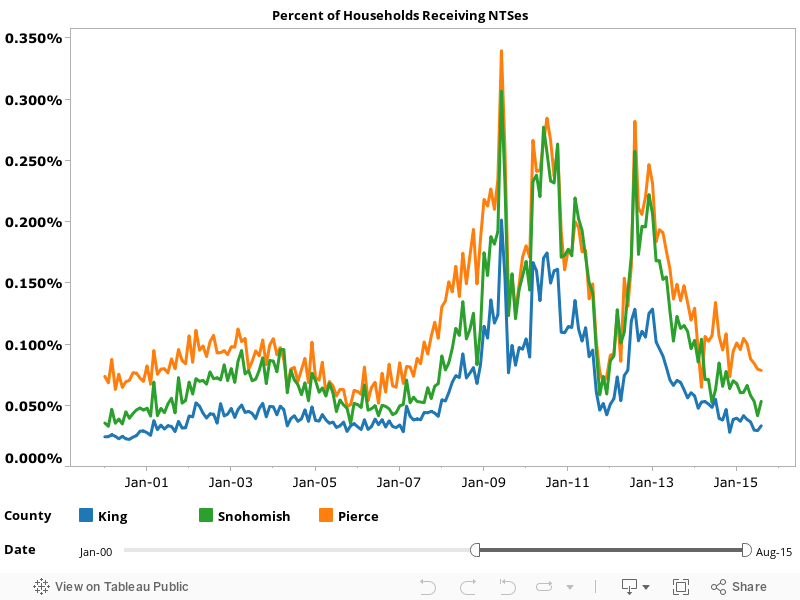
Hit the jump for a larger version of the chart that shows the percentage of households in each county receiving a foreclosure notice each month:
Note: The graphs above are derived from monthly Notice of Trustee Sale counts gathered at King, Snohomish, and Pierce County records. For a longer-term picture of King County foreclosures back to 1979, hit this chart and drag the date slider to its full range. For the full legal definition of what a Notice of Trustee Sale is and how it fits into the foreclosure process, check out RCW 61.24.040. The short version is that it is the notice sent to delinquent borrowers that their home will be repossessed in 90 days.