A recent commenter had some questions about inventory:
…how much of the “low inventory” story is really a story of “high churn”?
…it doesn’t seem like there is really a shortage of inventory, but rather that there is a shortage of stale inventory. Would be really curious to see how how new listing rates for houses added the market each month have been trending. My impression is that what we have is really not a shortage of sellers compared to historical norms, but an excess of very impatient buyers.
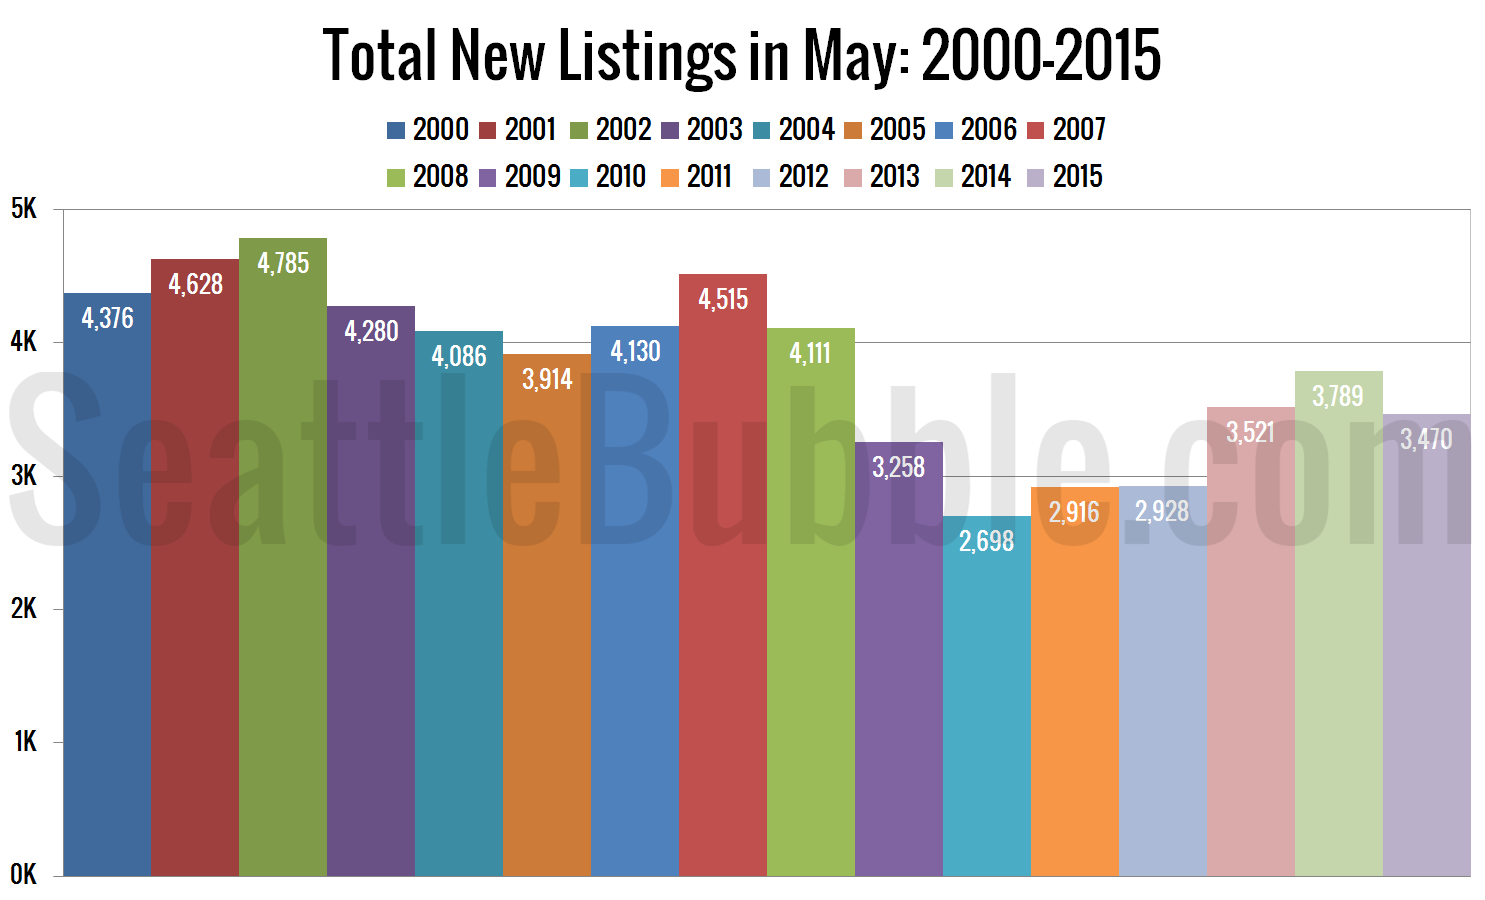
As it turns out, I’ve got charts for that. First up, here’s a look at new listings for just the last month, compared to May of every other year:
New listings in May were down from last year and 2013. The last three years have been quite a bit better than 2010-2012, but are still quite a bit worse than the historic level we saw before the bust.
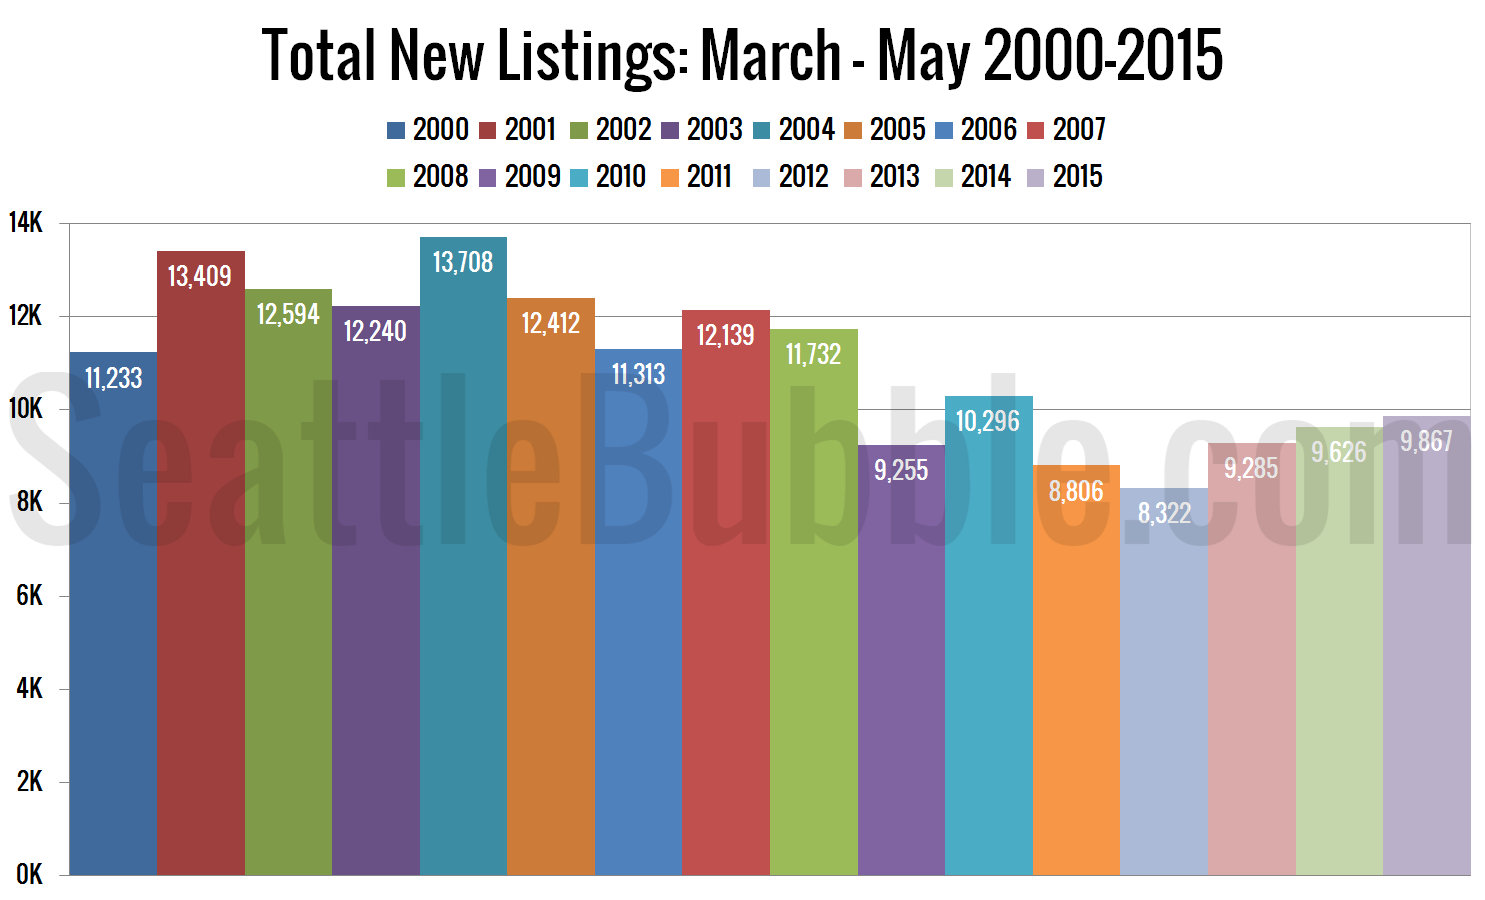
Here’s a look at the number of new listings added to the market in the last three months, compared to the same period in other years:
By this measure, new listings are at their highest level in the last five years, but again, still quite a bit below the pre-bust or even the pre-bubble levels.
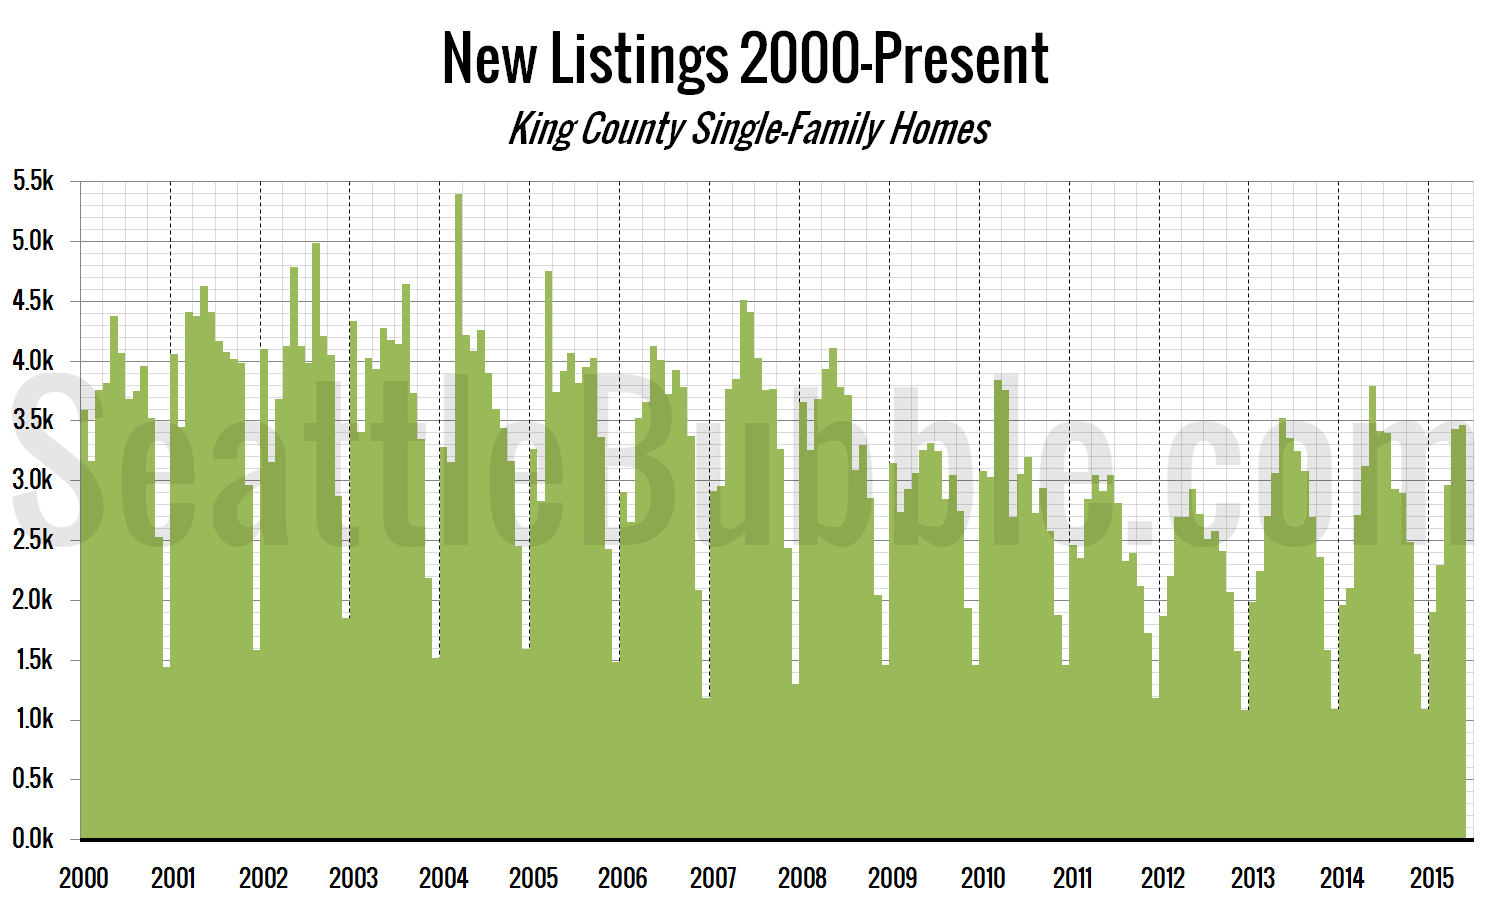
Here’s a long-term view of every month back through 2000:
Before the housing bubble burst, it was common to see more than 3,500 listings every month April through September, often more than 4,000 a month. So far this year we haven’t hit the 3,500 mark yet.
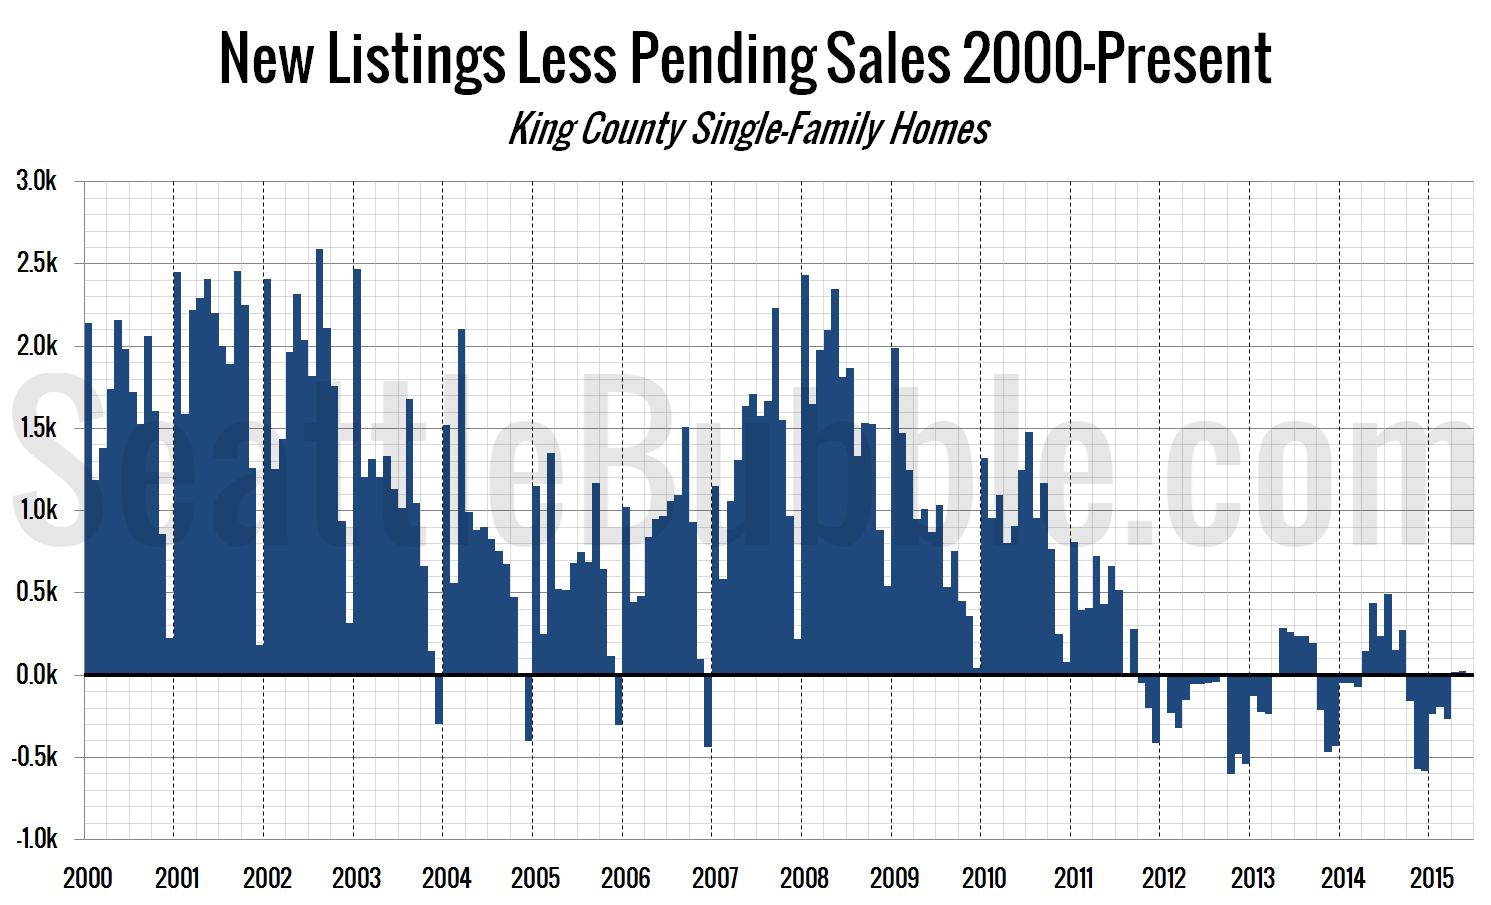
The next chart shows the difference between the number of new listings each month and the number of pending sales. Prior to late 2011 this number was almost always positive, except in December, when very few new listings hit the market. From October 2011 through March 2013 this measure was negative, indicating very tight inventory.
Last year this measure hit +100 in April and stayed well into the positive range for the next six months. This year it barely edged above zero in April and May.
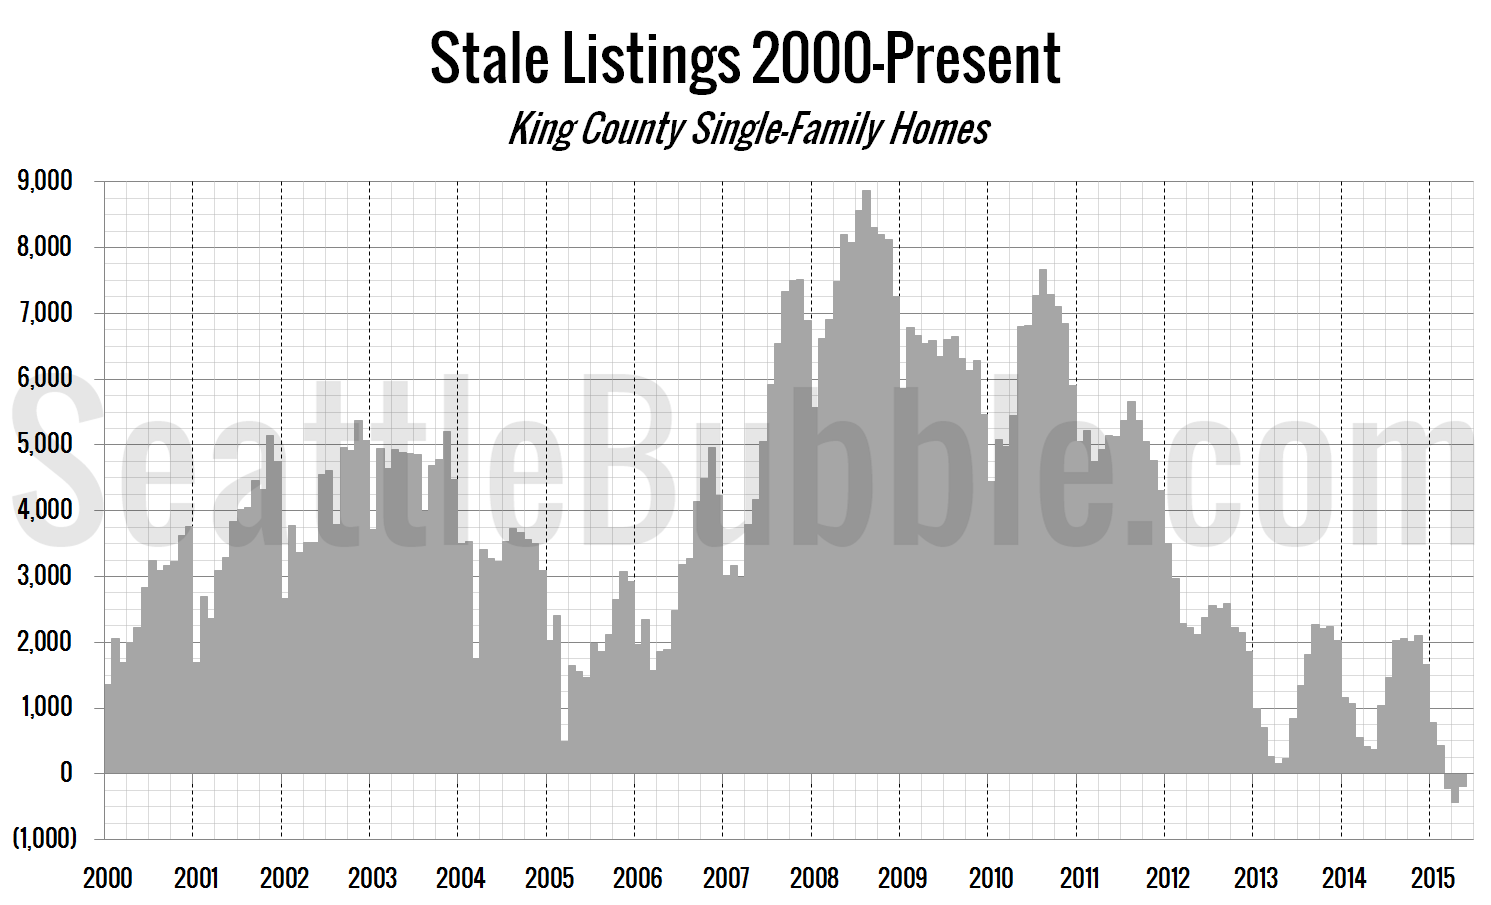
Finally, let’s take a look at the “stale listings” measure, which uses the total listings, new listings, and pending sales counts to estimate how many listings are “carried over” from one month to the next.
This number hasn’t ever been negative before this year. A negative number basically indicates that more listings sold in the month than were on the market at the end of last month.
There is definitely a high amount of “churn” right now, and obviously very few stale listings. However, no matter what way you measure, listings are still at very low levels in the current market.
