It’s been half a year since we last checked in on Consumer Confidence and mortgage interest rates, so let’s take a look at a long-overdue update to those charts.
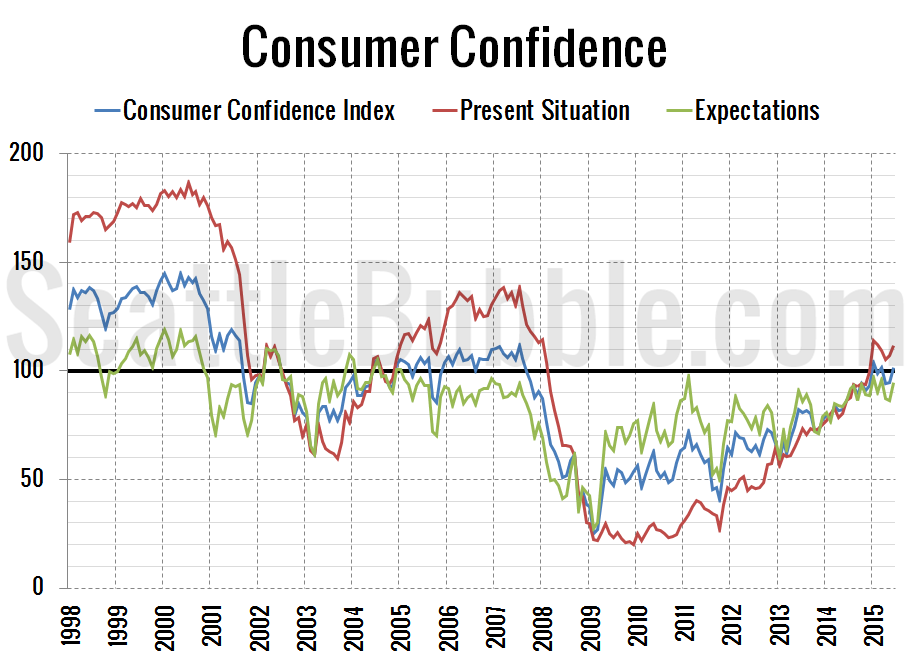
First up, here’s the Consumer Confidence data as of June:
The overall Consumer Confidence Index currently sits at 101.4, up 7 percent in a month and up 17 percent from a year ago.
At 111.6, the Present Situation Index increased 4 percent between May and June, and is up 29 percent from a year earlier. The Present Situation Index is currently up 452 percent from its December 2009 low point, but still down 19 percent from its pre-bust peak in July 2007.
The Expectations Index also rose in June, up 10 percent from May, and is up from a year earlier by 10 percent.
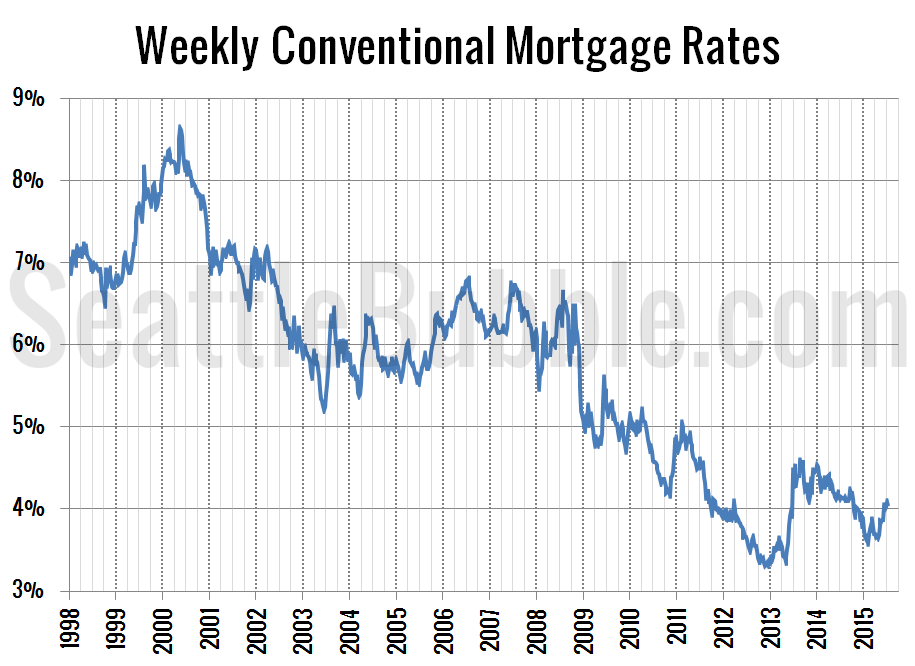
Here’s your chart of home mortgage 30-year interest rates via the Federal Reserve:
As of last week, the 30-year mortgage rate was at 4.04 percent, up slightly from the 3.74% January through May average. Current interest rates are roughly on par with where they were in September 2011 and still nearly two and a half points below the 6.41 percent average rate during the height of the housing bubble through 2006.
Enjoy the stupidly low interest rates while they last, it looks like that gravy train may finally be coming to an end later this year:
You heard it from the Federal Reserve Chair herself: interest rates will soon go up.
In prepared testimony to the House Financial Services Committee on Wednesday, Federal Reserve Chair Janet Yellen will say that as the U.S. economy continues to improve, “conditions likely would make it appropriate at some point this year to raise the federal funds rate target.”
Click below for the interactive Consumer Confidence chart (only works in Google Chrome).
You can use the sliders under the interactive chart below to zoom in on the data for a specific period.

