July market stats were published by the NWMLS today. Before we get into our monthly stats, here’s a quick look at their press release.
Pent up demand boosting Western Washington home sales and prices
Pent-up demand continues to fuel home sales around Western Washington with millennials, military families and relocating workers vying for limited inventory. Brokers from Northwest Multiple Listing Service say they’re not seeing a typical summer slowdown.
Commenting on a new report from Northwest Multiple Listing Services summarizing July activity, J. Lennox Scott, chairman and CEO of John L. Scott, Inc. said, “The Puget Sound housing market is sizzling hot, with the best July on record.” He expects inventory shortages will continue into the summer of 2016.
Everybody get on the home-buying train! It’s onward and upward to infinity! Nothing could possibly go wrong!
NWMLS monthly reports include an undisclosed and varying number of
sales from previous months in their pending and closed sales statistics.
Here’s your King County SFH summary, with the arrows to show whether the year-over-year direction of each indicator is favorable or unfavorable news for buyers and sellers (green = favorable, red = unfavorable):
| July 2015 | Number | MOM | YOY | Buyers | Sellers |
|---|---|---|---|---|---|
| Active Listings | 3,551 | +3.9% | -27.0% |  |
 |
| Closed Sales | 2,900 | -0.1% | +8.8% |  |
 |
| SAAS (?) | 1.18 | -0.3% | -13.2% |  |
 |
| Pending Sales | 3,197 | -3.7% | +10.2% |  |
 |
| Months of Supply | 1.18 | -3.7% | -34.5% |  |
 |
| Median Price* | $485,000 | -3.0% | +3.6% |  |
 |
Feel free to download the updated Seattle Bubble Spreadsheet, but keep in mind the caution above.
Summary: Still no improvements for home buyers. But hey, if you’re selling your home or you’re profiting from people selling their homes for more and more money, this market is awesome.
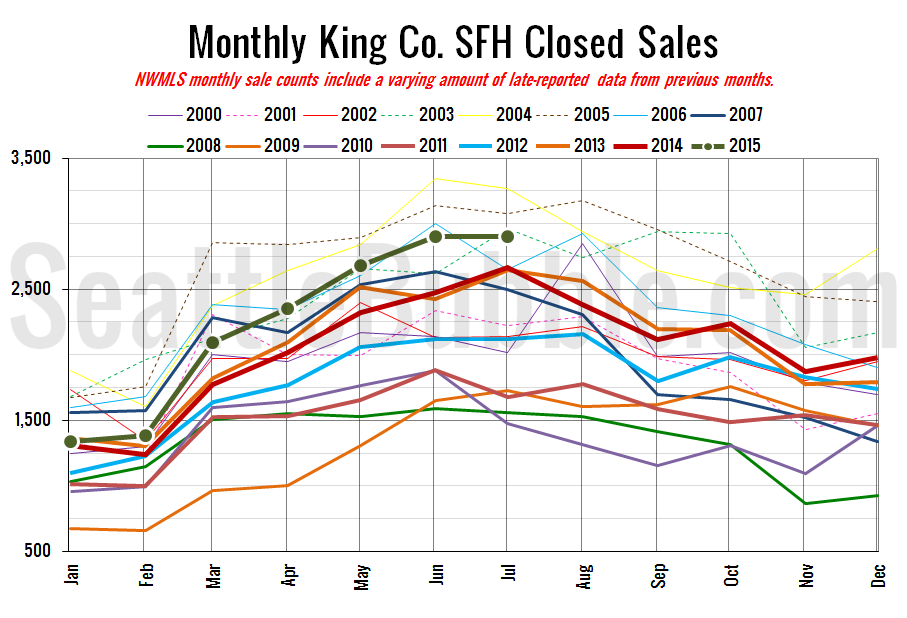
Here’s your closed sales yearly comparison chart:
Closed sales fell 0.1 percent from June to July. Last year they rose 7.7 percent over the same period. While it might be true that we are “not seeing a typical summer slowdown,” since 1993 through 2003 saw an average 10 percent decline in closed sales between June and July, we are slowing down, which is the opposite of what we saw between those months in 2014 (+7.7%) and 2013 (+9.3%).
This is the first indicator that we may actually be seeing the market start to cool off slightly.
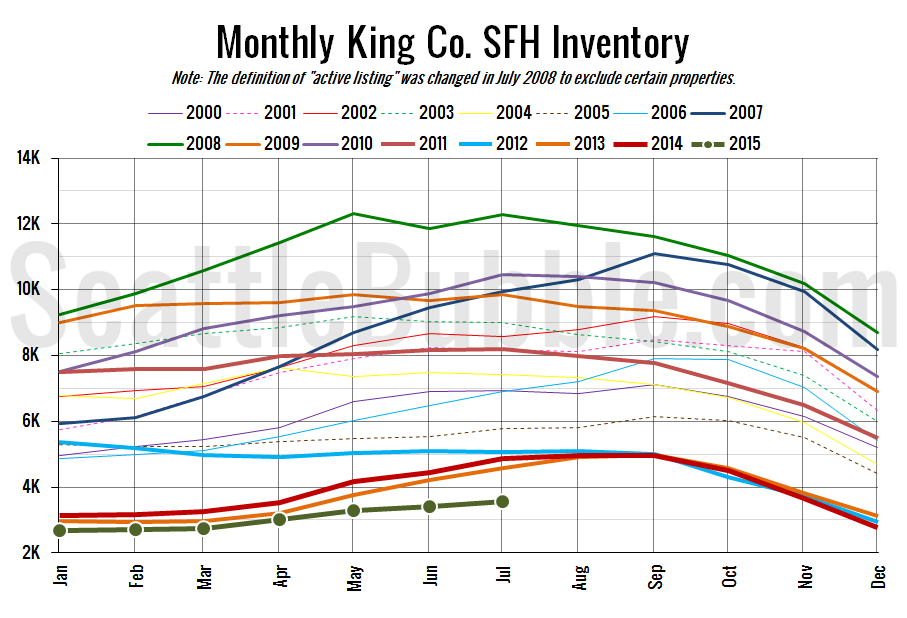
Here’s the graph of inventory with each year overlaid on the same chart.
Inventory inched up yet again June to July, but once again turned in the lowest ever recorded level for the time of year. Year-over-year inventory is still down double digits, with a slightly bigger decrease than last month.
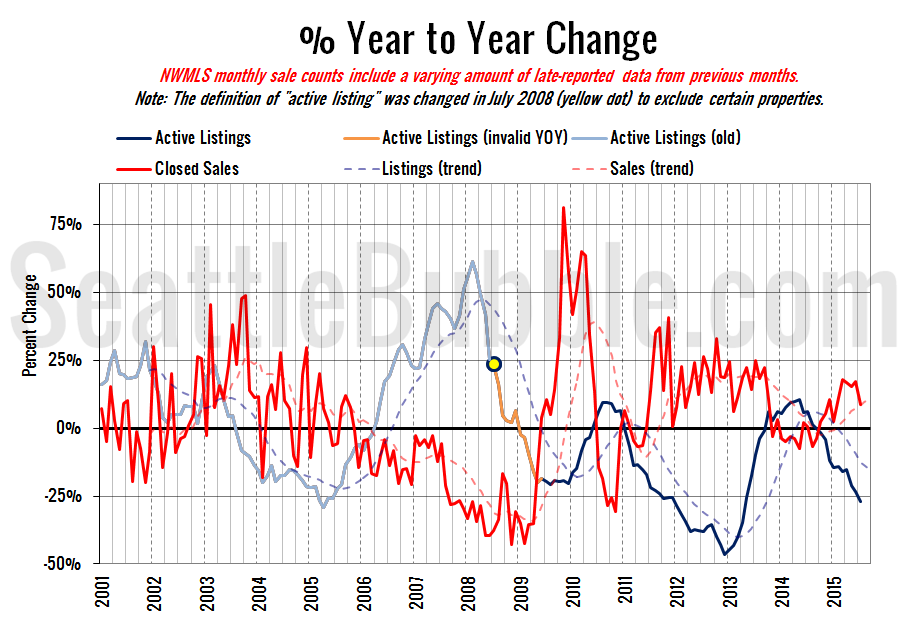
Here’s the supply/demand YOY graph. “Demand” in this chart is represented by closed sales, which have had a consistent definition throughout the decade (unlike pending sales from NWMLS).
Everything in this chart is still moving in sellers’ favor.
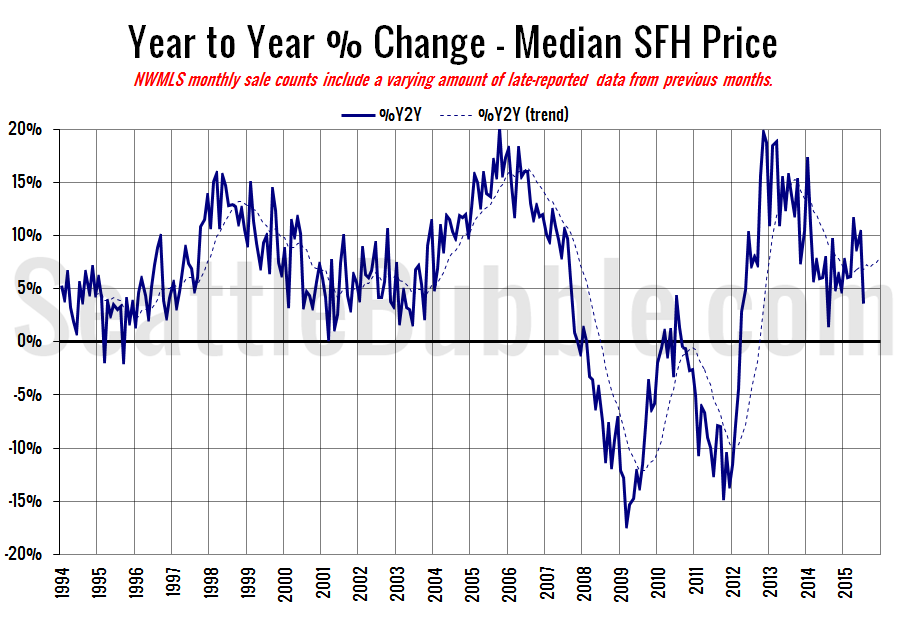
Here’s the median home price YOY change graph:
This is the largest drop in the year-over-year chart from one month to the next since November 2013.
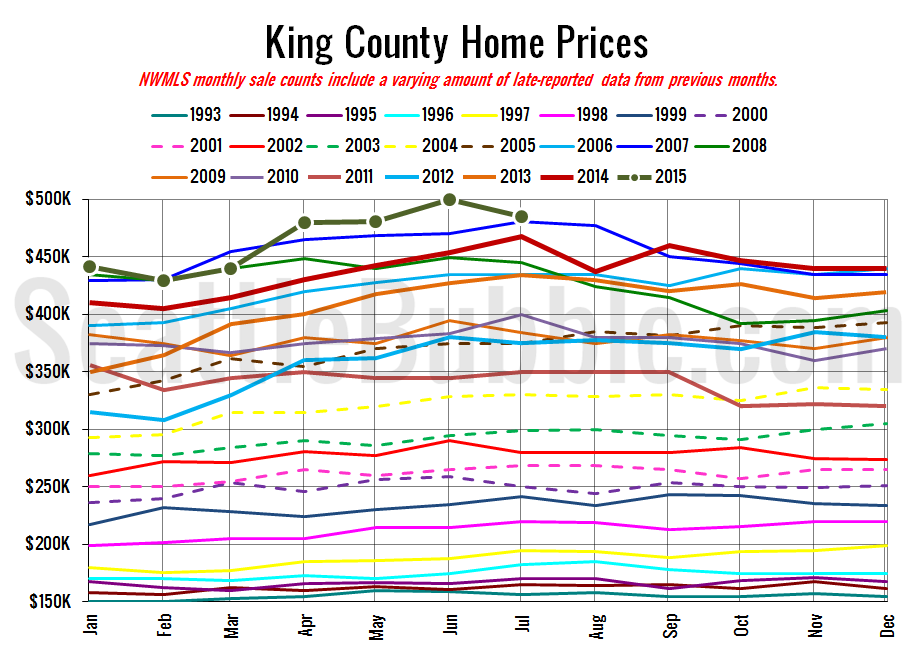
And lastly, here is the chart comparing King County SFH prices each month for every year back to 1994 (not adjusted for inflation).
The median home price fell back in July from the new all-time high set in June (not adjusted for inflation).
July 2015: $485,000
July 2007: $481,000 (pre-2015 high)
Here’s this month’s article from the Seattle Times: King County median home price slips in July
Check back tomorrow for the full reporting roundup.
