Get access to the full spreadsheets used to make the charts in this and other posts, as well as a variety of additional insider benefits by becoming a member of Seattle Bubble.
August market stats were published by the NWMLS yesterday. Before we get into our monthly stats, here’s a quick look at their press release.
Opinions vary on possibility of a housing slowdown, but numbers show solid activity
Some brokers from Northwest Multiple Listing Service detected a slowdown in housing activity during August, “but nowhere near what is typical,” according to one industry veteran. Among MLS leaders who commented on the service’s latest report, expectations for the remainder of 2015 ranged from one who predicted “we’re on the cusp of a slowdown,” to others describing activity as “torrid” and saying “sales will continue at a fast pace.”
No home salesperson ever went wrong predicting that a hot market will continue. Er, wait.
NWMLS monthly reports include an undisclosed and varying number of
sales from previous months in their pending and closed sales statistics.
Here’s your King County SFH summary, with the arrows to show whether the year-over-year direction of each indicator is favorable or unfavorable news for buyers and sellers (green = favorable, red = unfavorable):
| August 2015 | Number | MOM | YOY | Buyers | Sellers |
|---|---|---|---|---|---|
| Active Listings | 3,490 | -1.7% | -29.7% |  |
 |
| Closed Sales | 2,575 | -11.2% | +8.0% |  |
 |
| SAAS (?) | 1.25 | +6.6% | -6.1% |  |
 |
| Pending Sales | 2,971 | -7.1% | +6.8% |  |
 |
| Months of Supply | 1.36 | +10.7% | -34.9% |  |
 |
| Median Price* | $499,950 | +3.1% | +14.4% |  |
 |
Summary: No sign of any dramatic changes. The market is still strongly in sellers’ favor, and looks like it will stay that way for quite a while.
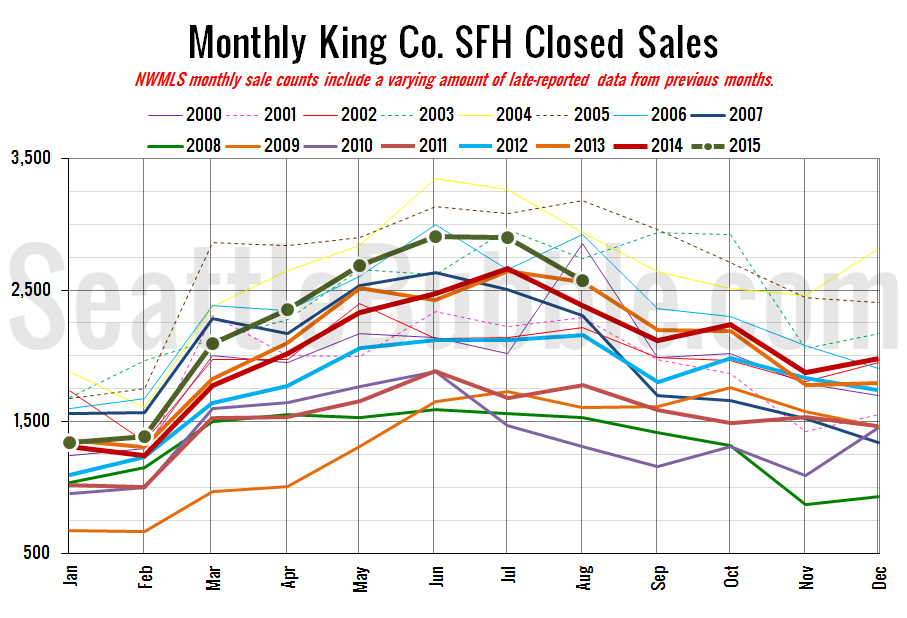
Here’s your closed sales yearly comparison chart:
Closed sales fell 11 percent from July to August. Last year they also fell about 11 percent over the same period. The prior ten years (2004-2013) saw an average 2 percent decline in closed sales between July and August, so the last two years the market has been slowing in August a lot more quickly than has been typical. Meanwhile year-over-year closed sales dropped to the lowest level since January.
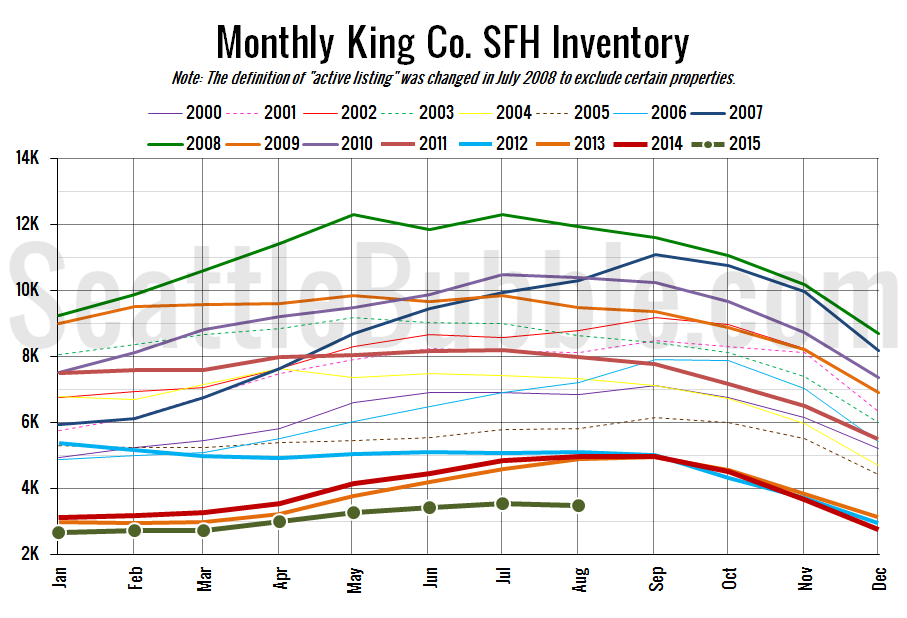
Here’s the graph of inventory with each year overlaid on the same chart.
Inventory dropped slightly from July to August, while the year-over-year number fell to its lowest point since April 2013.
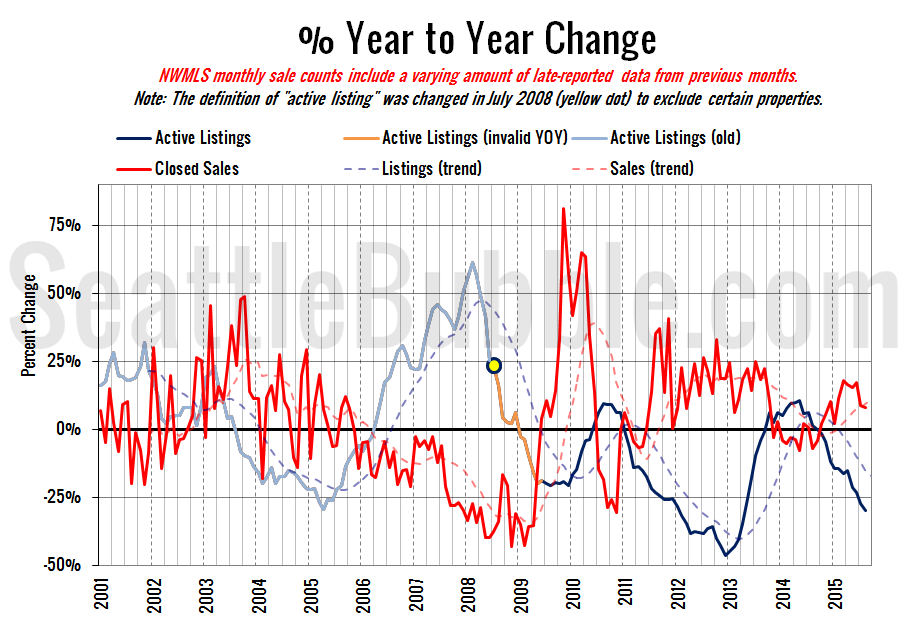
Here’s the supply/demand YOY graph. “Demand” in this chart is represented by closed sales, which have had a consistent definition throughout the decade (unlike pending sales from NWMLS).
Everything in this chart is still in sellers’ favor, but the demand side (closed sales) has at least been inching back toward buyer’s territory for the last few months.
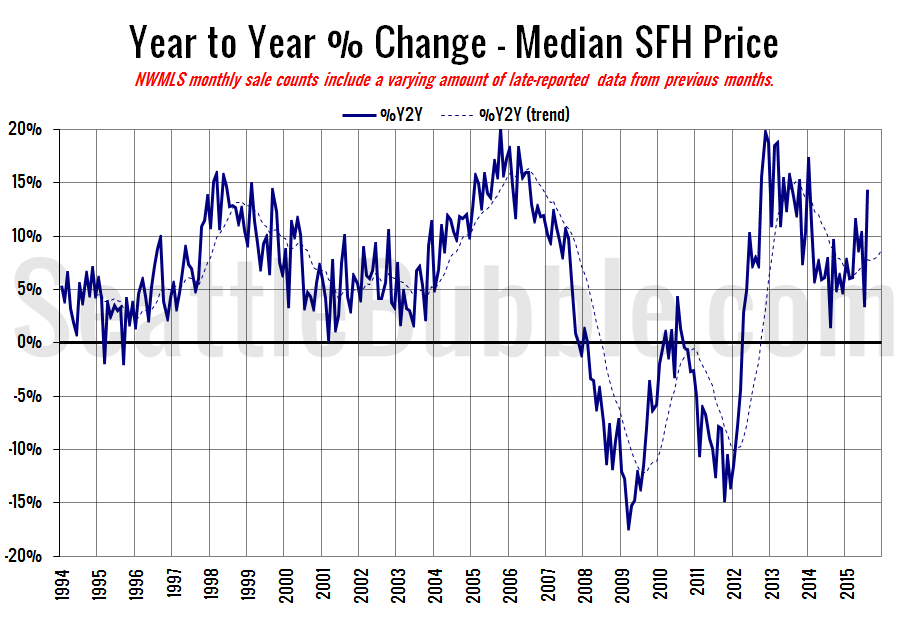
Here’s the median home price YOY change graph:
Huge swing from +3.6 percent in July to +14.4 percent in August.
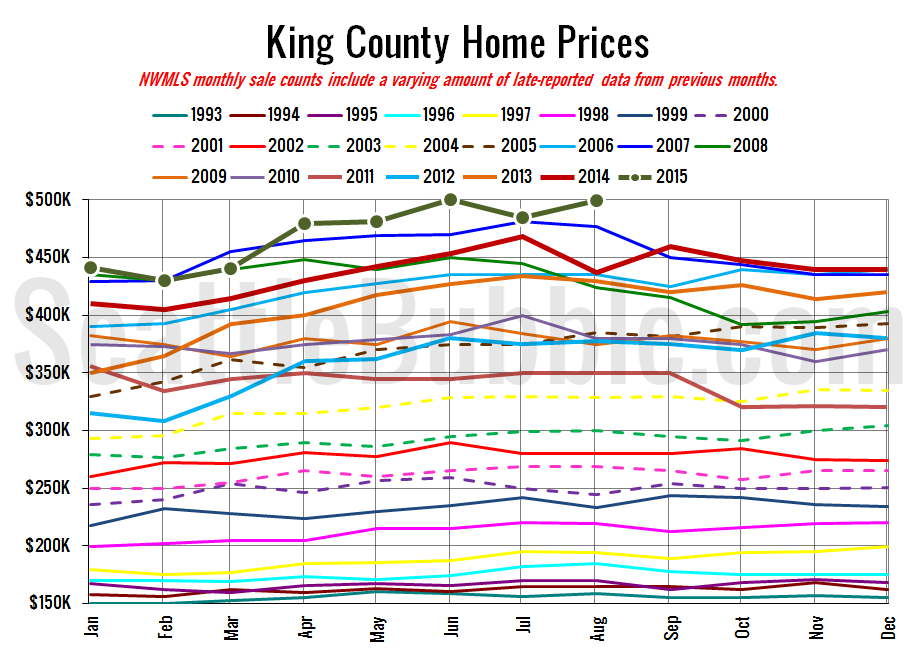
And lastly, here is the chart comparing King County SFH prices each month for every year back to 1994 (not adjusted for inflation).
The median home price hit a new all-time high in August (not adjusted for inflation).
August 2015: $499,950
July 2007: $481,000 (pre-2015 high)
Here’s this month’s article from the Seattle Times: Condo prices climbing even faster than houses
Check back on Monday for the full reporting roundup.
