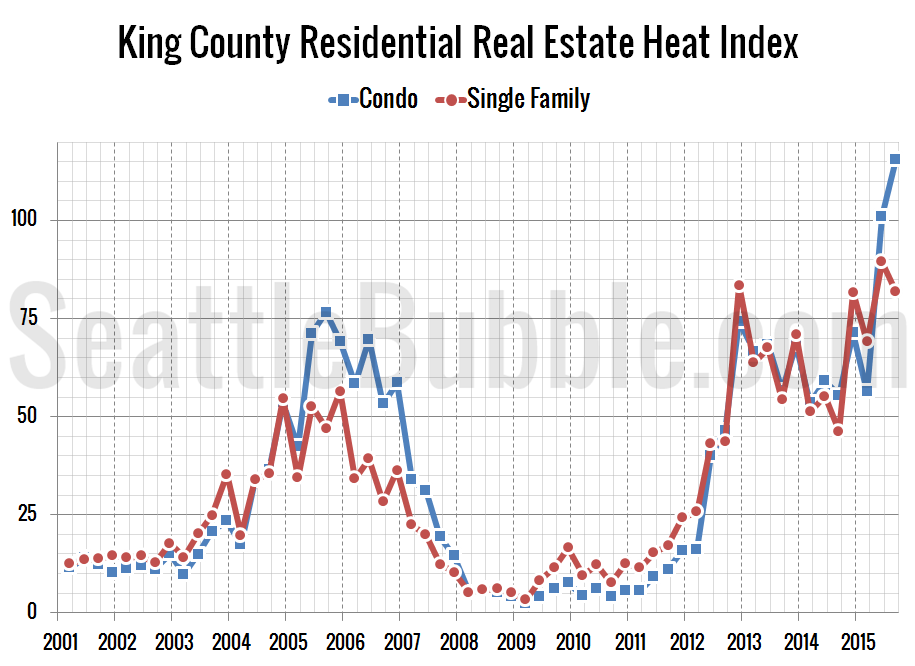
I’d like to introduce a new chart. The “Residential Real Estate Heat Index” is an index I’ve been calculating for a few years, that originally was part of the now-defunct Sound Housing Quarterly newsletter. It rolls changes in the median price, new listings, total inventory, pending sales and closed sales all into a single number to measure the relative “heat” of the market.
Here’s what it looks like for King County single-family homes and condos.
The last two quarters (April through September) of this year have seen the hottest local real estate market as far back as I have reliable data.
At 81.8, the latest King County heat index is nearly double the average during the last bubble (42.6). As with the last bubble, the condo heat index is even more out of control, coming in at 115.6 in the third quarter (88 percent higher than the 61.4 average during the last bubble).
Based on this measure, we are well into another bubble at this point. That said, there are still many factors that are very different from last time, so the only thing I know for sure is that this one won’t end the same way the last one did.
If there’s enough interest, I can compile this chart for other counties as well. Also: If you’re a Seattle Bubble Member, check the shared spreadsheet folder for the full data behind this chart.
[P.S. – I apologize for the light posting recently. It’s been very busy for me personally lately. Plus my dog died, so there’s that.]
