Get access to the full spreadsheets used to make the charts in this and other posts, as well as a variety of additional insider benefits by becoming a member of Seattle Bubble.
October market stats were published by the NWMLS yesterday. Before we get into our monthly stats, here’s a quick look at their press release.
Real estate brokers expect only a modest holiday slowdown
But prices in most areas are still risingWith holidays approaching, real estate brokers usually expect a slowdown as buyers and sellers shift their attention elsewhere. “This year is different,” say some industry leaders.
“Today we have one of the best markets we’ve ever seen for sellers,” observed Ken Anderson, managing broker and owner at Coldwell Banker Evergreen in Olympia. “Buyers are still surging to the market and inventory is low. It’s a very good time to sell. Owners who are eager to make the next move don’t have to wait six months or until spring to act,” added Anderson, a former board member at Northwest Multiple Listing Service.
“Buyers are still surging to the market” is definitely not how I would describe a month-over-month decline in pending and closed sales, and year-over-year sales growth of just 1-2 percent. But then again I am not a used home salesman.
NWMLS monthly reports include an undisclosed and varying number of
sales from previous months in their pending and closed sales statistics.
Here’s your King County SFH summary, with the arrows to show whether the year-over-year direction of each indicator is favorable or unfavorable news for buyers and sellers (green = favorable, red = unfavorable):
| October 2015 | Number | MOM | YOY | Buyers | Sellers |
|---|---|---|---|---|---|
| Active Listings | 3,064 | -10.0% | -32.0% |  |
 |
| Closed Sales | 2,301 | -2.7% | +2.8% |  |
 |
| SAAS (?) | 1.06 | -2.8% | -8.1% |  |
 |
| Pending Sales | 2,675 | -2.8% | +1.3% |  |
 |
| Months of Supply | 1.33 | -7.5% | -33.8% |  |
 |
| Median Price* | $480,000 | -2.1% | +7.3% |  |
 |
I continue to be surprised that prices are not up 10 to 20 percent year-over-year, with the strong sales and weak inventory numbers we’ve seen all year. Between 2000 and 2014, five years saw sales increase between September and October, but on average across the 15 years, sales were flat over the period. This year’s 3 percent decline is definitely not a strong signal, but it’s not a sign that a market collapse is imminent, either.
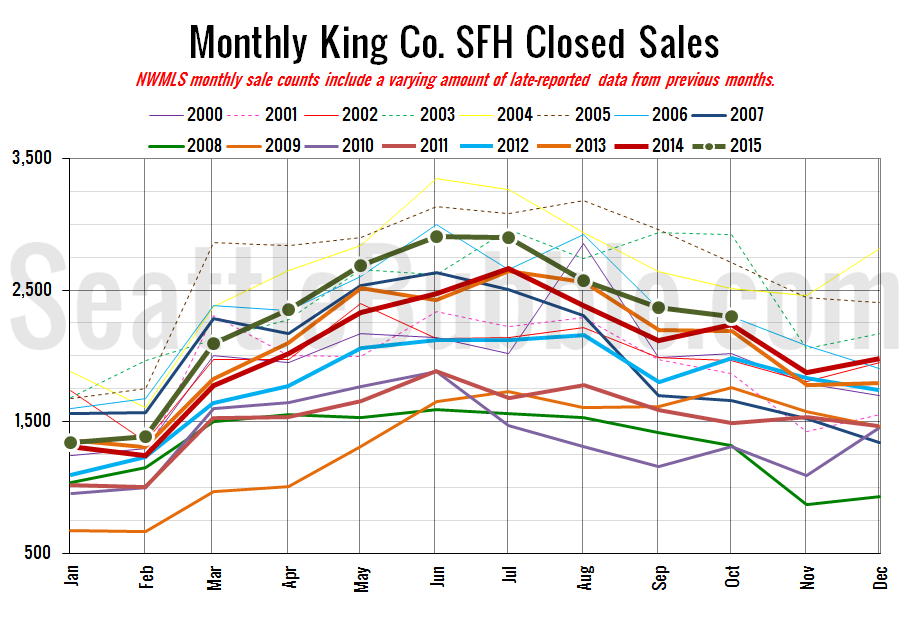
Here’s your closed sales yearly comparison chart:
Closed sales fell 3 percent from September to October. Last year they rose 6 percent over the same period. Meanwhile year-over-year closed sales dropped significantly slightly to the lowest level since January.
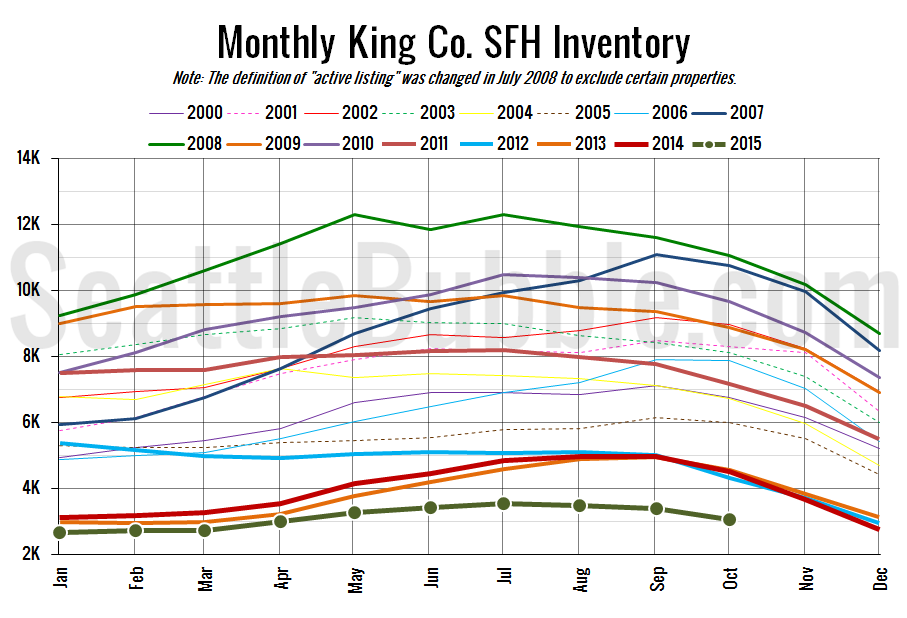
Here’s the graph of inventory with each year overlaid on the same chart.
Inventory fell again from September to October, while the year-over-year number continued to drop as well. At this rate January will most likely set a new record for low on-market inventory.
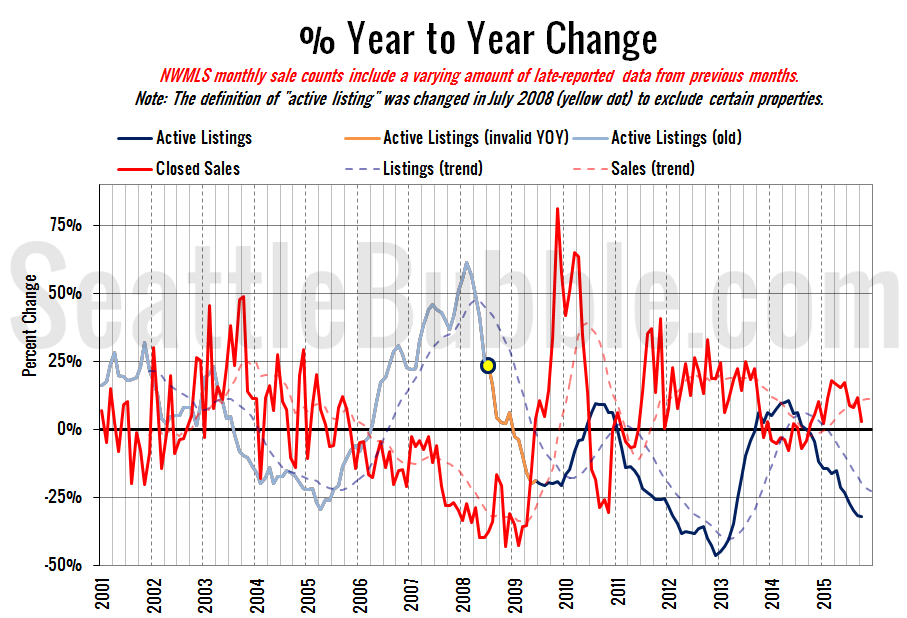
Here’s the supply/demand YOY graph. “Demand” in this chart is represented by closed sales, which have had a consistent definition throughout the decade (unlike pending sales from NWMLS).
Everything in this chart is still in sellers’ favor, but the demand line moved toward balanced market territory in October.
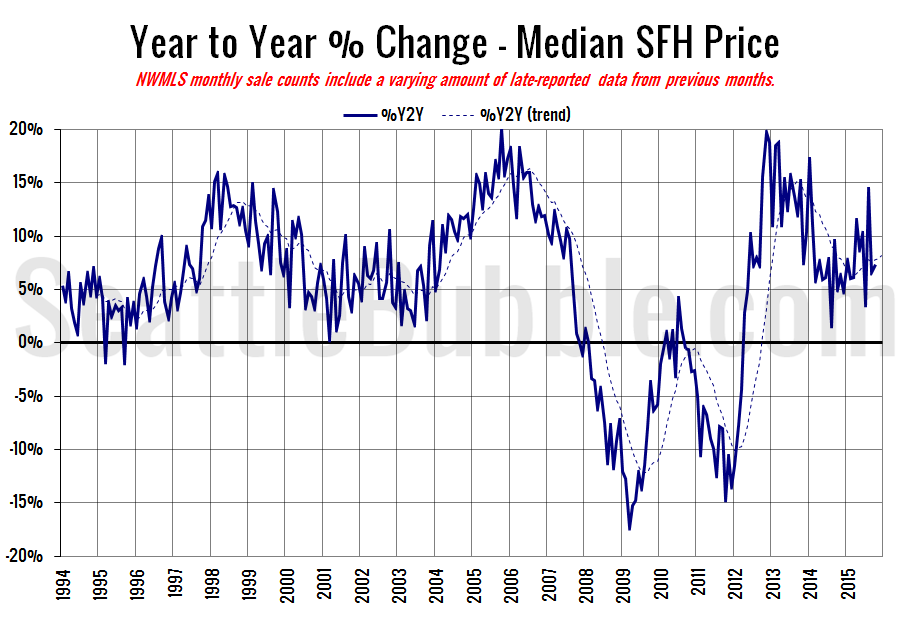
Here’s the median home price YOY change graph:
Not much change in this chart, which moved from +6.6 percent in September to +7.3 percent in October.
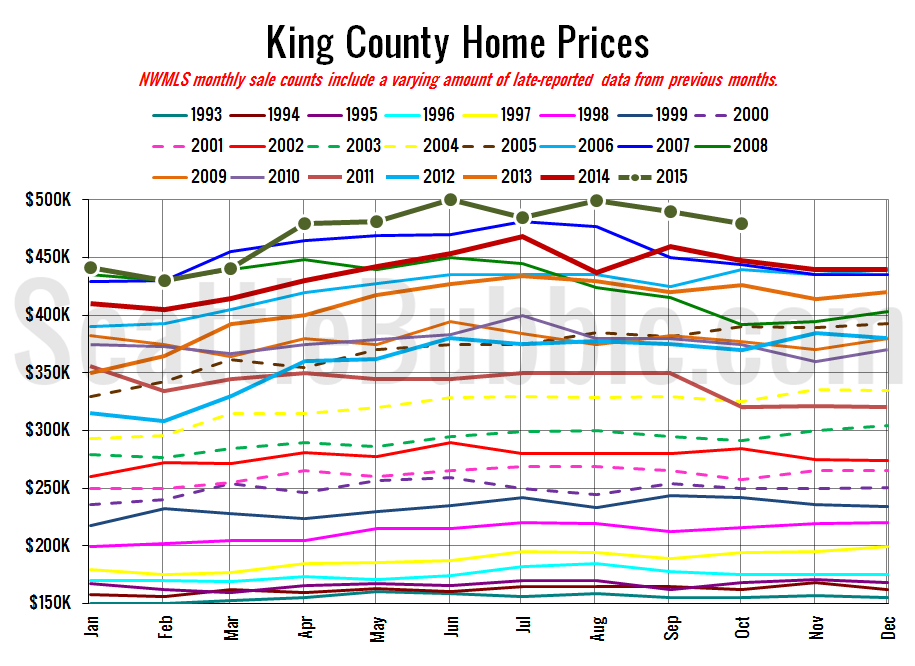
And lastly, here is the chart comparing King County SFH prices each month for every year back to 1994 (not adjusted for inflation).
The median home price continues to bouncing around in the same $480,000 to $500,000 range it has been in since April.
October 2015: $480,000
July 2007: $481,000 (pre-2015 high)
Here’s this month’s article from the Seattle Times: Short supply pushes up region’s home prices
Check back Monday for the full reporting roundup.
