Get access to the full spreadsheets used to make the charts in this and other posts, as well as a variety of additional insider benefits by becoming a member of Seattle Bubble. Thanks to our newest members, Larry, Jonathan, Jonathan, Kevin, and Dave! I really appreciate your support.
March market stats were published by the NWMLS yesterday. Before we get into our monthly stats, here’s a quick look at their press release.
Puget Sound Area Home Sales Slow (But Not Prices)
Traffic isn’t the only thing that is gridlocked around many Puget Sound communities. “We’re experiencing gridlock in the Puget Sound housing market,” suggested J. Lennox Scott in reaction to the latest statistics from Northwest Multiple Listing Service.
…
“We are virtually sold out of inventory and there’s a pipeline of stalled buyers,” commented Scott, the chairman and CEO of John L. Scott, Inc.
…
The year-to-date drop in pending sales versus first quarter 2015 is a reflection of tight inventory, according to MLS members. “It’s not for any other reason except there aren’t enough homes coming on the market to satisfy pent-up buyer demand,” stated Scott.
We can trust J. Lennox Scott’s assessment of the underlying forces at work in the local housing market, because he has always been 100% correct in his previous market analysis. Oh. Wait.
NWMLS monthly reports include an undisclosed and varying number of
sales from previous months in their pending and closed sales statistics.
Here’s your King County SFH summary, with the arrows to show whether the year-over-year direction of each indicator is favorable or unfavorable news for buyers and sellers (green = favorable, red = unfavorable):
| March 2016 | Number | MOM | YOY | Buyers | Sellers |
|---|---|---|---|---|---|
| Active Listings | 2,157 | +12.2% | -21.2% |  |
 |
| Closed Sales | 1,910 | +43.6% | -8.7% |  |
 |
| SAAS (?) | 1.43 | +10.6% | +9.5% |  |
 |
| Pending Sales | 2,877 | +25.1% | -11.0% |  |
 |
| Months of Supply | 1.13 | -21.9% | -13.7% |  |
 |
| Median Price* | $531,250 | +3.2% | +20.7% |  |
 |
First the good news for buyers: Inventory saw a slight uptick in March, and the year-over-year drop shrunk significantly from -29 percent in February to -21 percent in March. Sales also appear to be slowing down slightly as both pending and closed sales are down around ten percent from a year ago.
Now the bad news: The median home price shot up to a new all-time high, and the year-over-year median price was up a record-breaking 21 percent.
It is worth noting that when the last bubble burst, sales were declining for nearly two years and inventory was climbing for about a year before home prices eventually peaked.
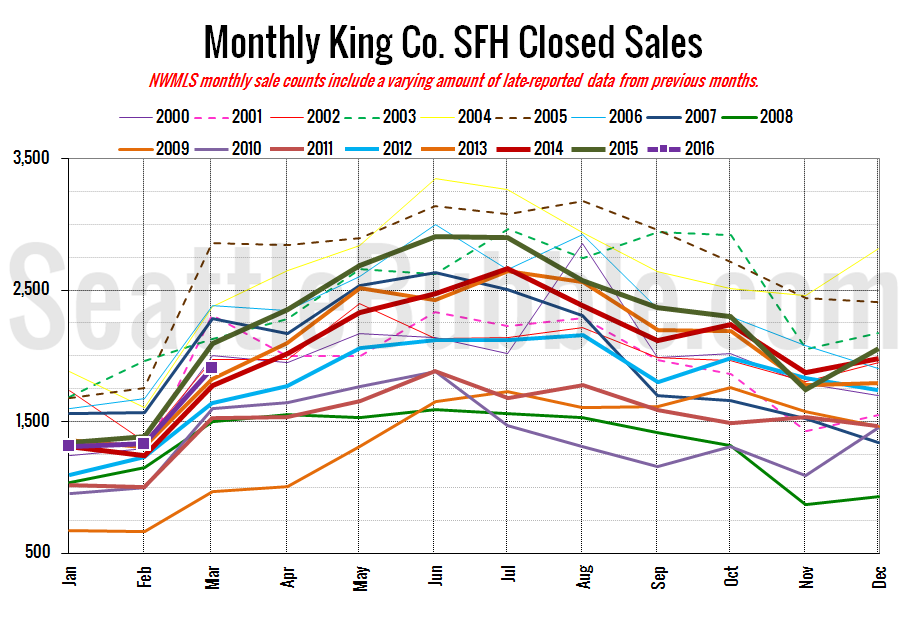
Here’s your closed sales yearly comparison chart:
Closed sales were up from February, by a similar amount to most years. The year-over-year drop in closed sales was the largest decline we’ve seen since November 2010. If this keeps up, 2016 could be the turning point for this cycle. Or the last few months could just be a blip. We’ll know more in a few months.
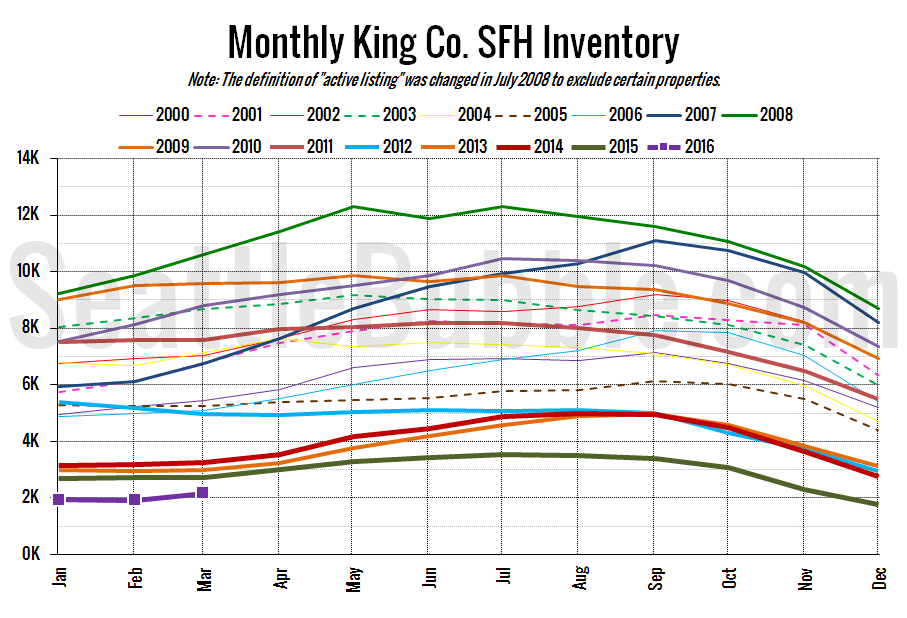
Here’s the graph of inventory with each year overlaid on the same chart.
Total inventory is at its lowest March level on record. The good news is that the 12 percent month-over-month increase in listings is the largest February to March increase on record.
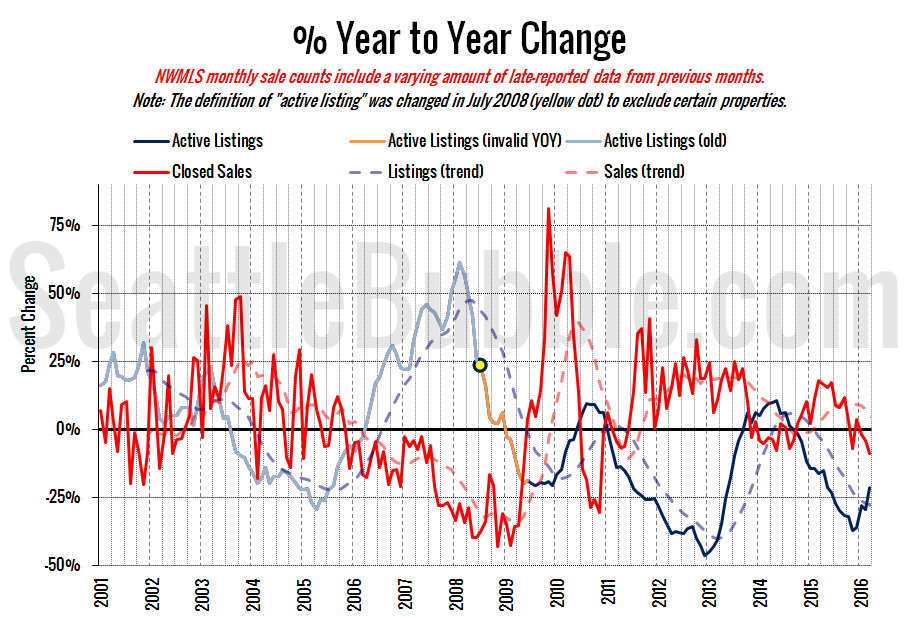
Here’s the supply/demand YOY graph. “Demand” in this chart is represented by closed sales, which have had a consistent definition throughout the decade (unlike pending sales from NWMLS).
Both the red demand line and the blue supply line inched toward buyer’s market territory in March. The demand side of the chart is further in buyer’s territory than it has been in over five years, but the supply side is still deep in seller’s market territory, which is the biggest driving force of the market right now.
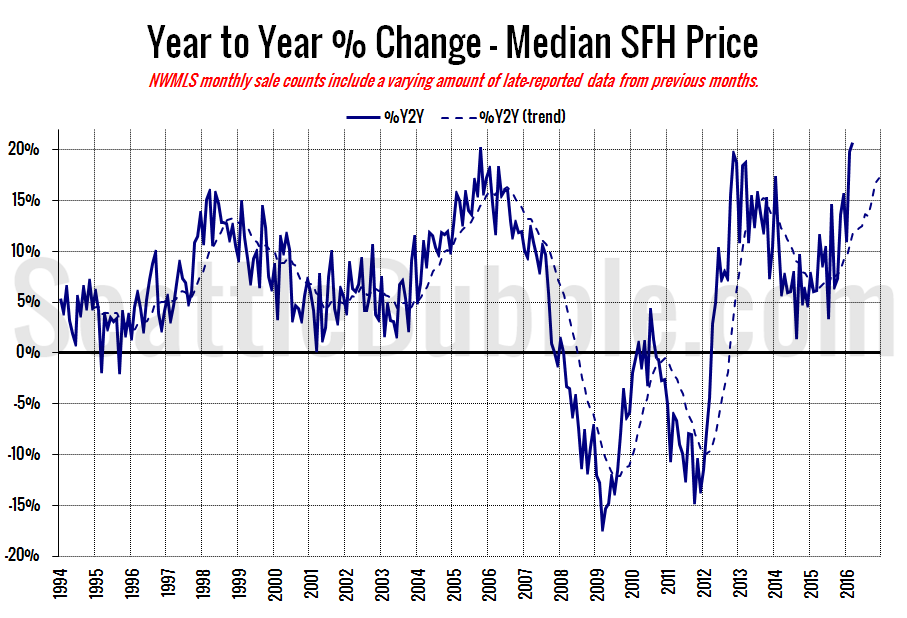
Here’s the median home price YOY change graph:
Year-over-year price growth inched up from +19.8 percent in February to a record-breaking 20.7 percent in March. That surpasses the previous peak gain of +20.0 percent that was set in October 2005.
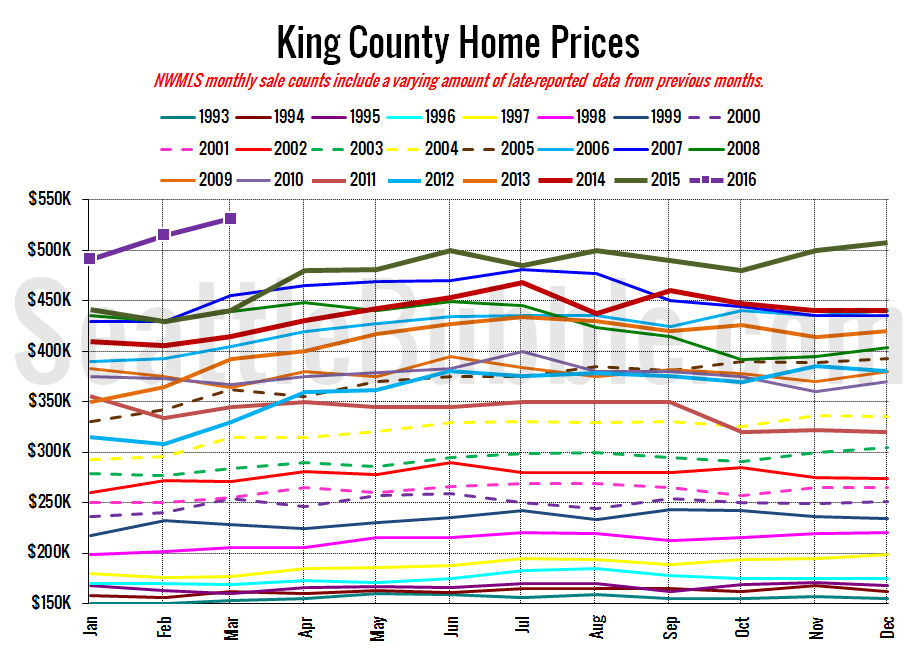
And lastly, here is the chart comparing King County SFH prices each month for every year back to 1994 (not adjusted for inflation).
Another ridiculously high level for the median home price. There’s never been a better time to sell your home.
March 2016: $531,250
July 2007: $481,000 (previous cycle high)
Here’s this month’s article from the Seattle Times: Squeeze on homes for sale extends to several counties
Check back later for the full reporting roundup.
