Note to subscribers: The members-only spreadsheets folder has been updated to include the charts in this post.
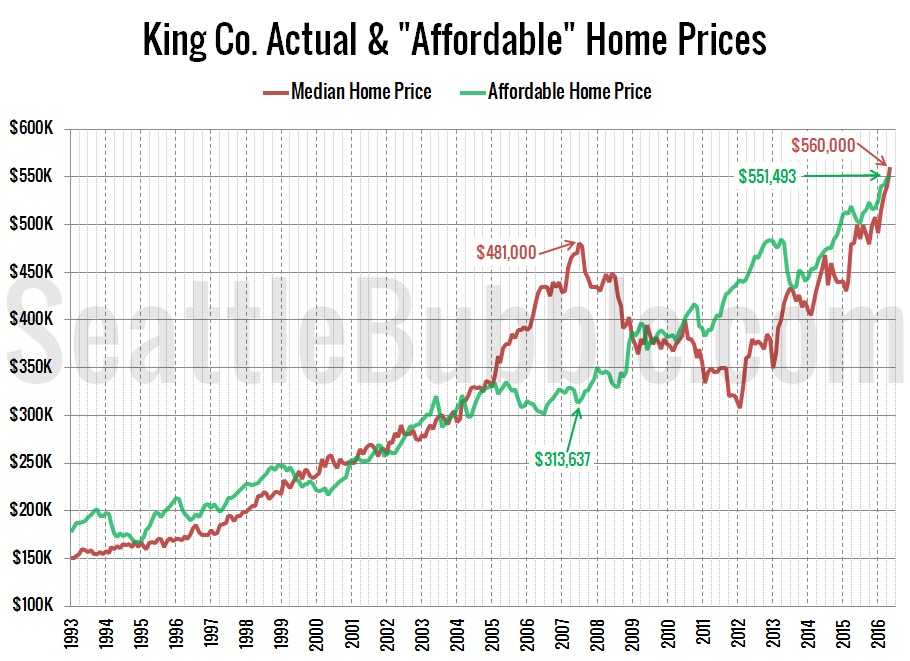
As promised in yesterday’s affordability post, here’s an updated look at the “affordable home” price chart.
In this graph I flip the variables in the affordability index calculation around to other sides of the equation to calculate what price home the a family earning the median household income could “afford” to buy at today’s mortgage rates, if they spent 30% of their monthly gross income on their home payment. Don’t forget that this math includes the (giant) assumption that the home buyers putting 20% down, which would be $112,000 at today’s median price.
The “affordable” home price hit an all-time high of $551,493 in May, thanks to increasing incomes and decreasing mortgage interest rates. The “affordable” home price of $551,493 in King County would have a monthly payment of $2,006.
If interest rates were at a more reasonable level of 6 percent (which is still quite low by historical standards), the “affordable” home price would be just $382,986—about $103,000 lower than it is today.
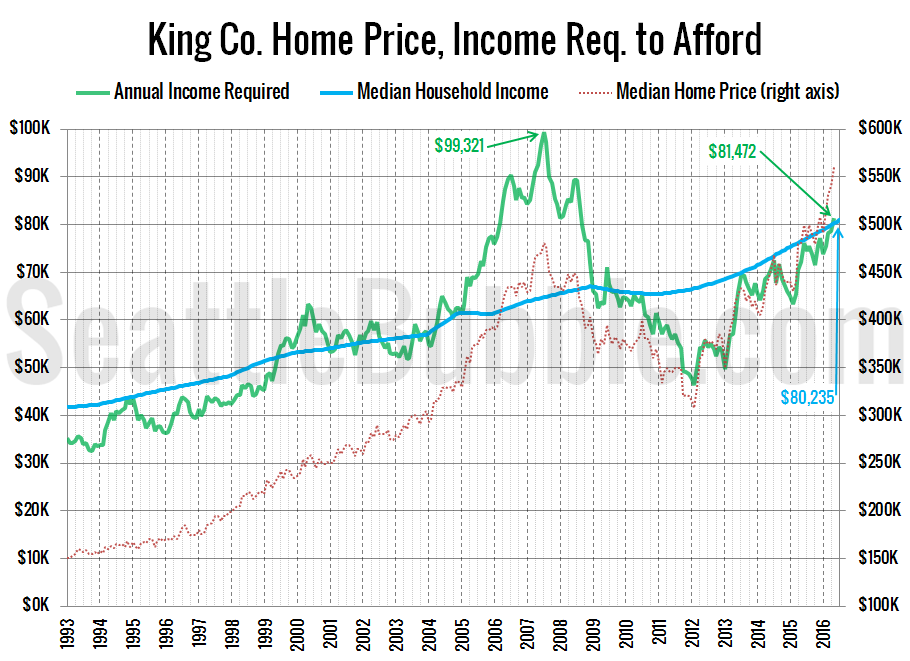
Here’s the alternate view on this data, where I flip the numbers around to calculate the household income required to make the median-priced home affordable at today’s mortgage rates, and compare that to actual median household incomes.
As of May, a household would need to earn $81,472 a year to be able to “afford” the median-priced $560,000 home in King County. This is up from the low of $46,450 in February 2012, but about 18 percent below the all-time high set in July 2007. Meanwhile, the actual median household income is about the same at around $80,235.
If interest rates were 6% (around the pre-bust level), the income necessary to buy a median-priced home would be $107,439—34 percent above the current median income. If the commenters on yesterday’s post are correct and absurdly low rates are here to stay, then today’s home prices, as sky high as they are, are completely reasonable.

