Get access to the full spreadsheets used to make the charts in this and other posts, and support the ongoing work on this site by becoming a member of Seattle Bubble.
Let’s have a look at our housing stats for the broader Puget Sound area. Here’s your June update to our “Around the Sound” statistics for Pierce, Kitsap, Thurston, Island, Skagit, and Whatcom counties.
Recently we’re beginning to see some interesting differences between King County and the other counties in the region…
First up, a summary table:
| June 2016 | King | Snohomish | Pierce | Kitsap | Thurston | Island | Skagit | Whatcom |
|---|---|---|---|---|---|---|---|---|
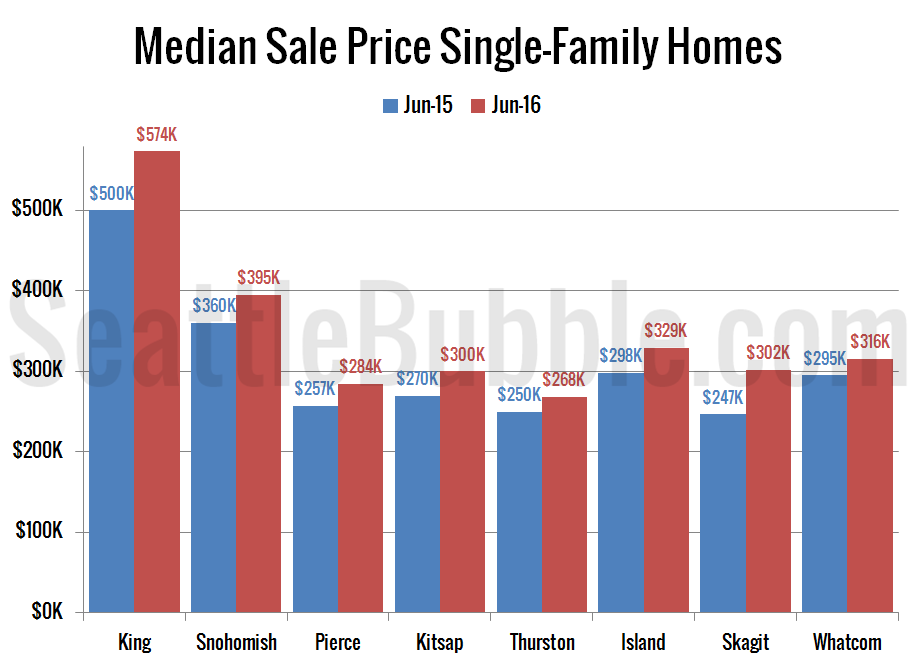
| Median Price | $573,522 | $395,000 | $284,200 | $299,975 | $268,000 | $329,000 | $302,000 | $316,000 |
| Price YOY | 14.7% | 9.7% | 10.6% | 11.1% | 7.2% | 10.3% | 22.5% | 7.1% |
| Active Listings | 3,177 | 1,529 | 2,322 | 758 | 989 | 492 | 508 | 860 |
| Listings YOY | -7.1% | -22.6% | -20.6% | -17.6% | -10.3% | -17.4% | -15.9% | -19.5% |
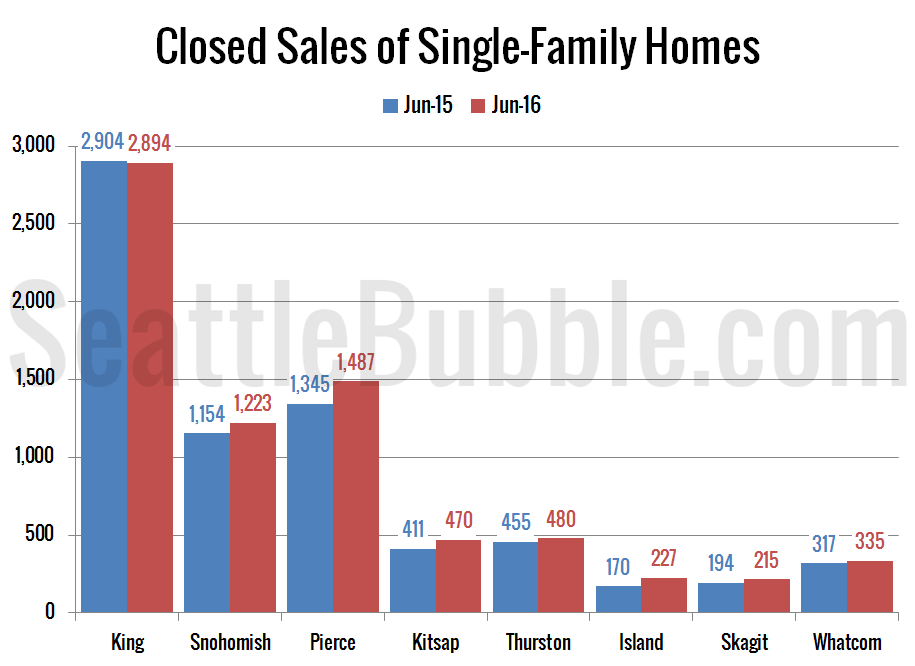
| Closed Sales | 2,894 | 1,223 | 1,487 | 470 | 480 | 227 | 215 | 335 |
| Sales YOY | -0.3% | 6.0% | 10.6% | 14.4% | 5.5% | 33.5% | 10.8% | 5.7% |
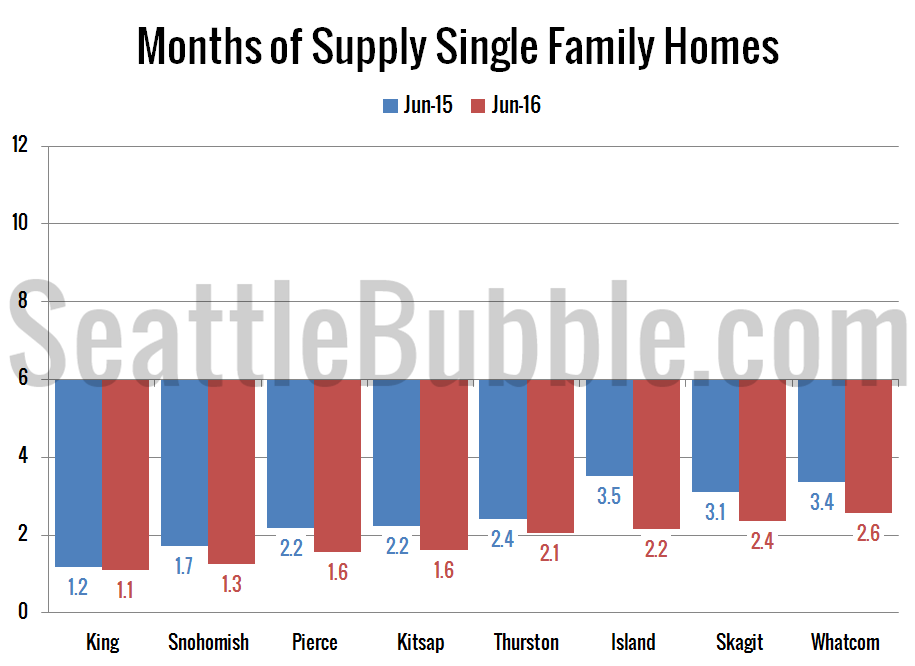
| Months of Supply | 1.1 | 1.3 | 1.6 | 1.6 | 2.1 | 2.2 | 2.4 | 2.6 |
With far and away the highest median price, King County is the only county where sales are not increasing year-over-year. King County is also an outlier with the smallest year-over-year decline in listings. Every other county saw a double-digit drop in listings, while King County is aproaching a flatline on inventory.
Prices are up across the board from a year ago. Skagit turned in the largest increase on a percentage basis.
Listings are down from a year ago across the board, but the drop in King County is actually the smallest that it’s been in a while, down “just” seven percent. The biggest dips were in Snohomish and Pierce Counties, which were both down by over 20 percent from a year earlier.
Closed sales were up in every county except King in June. The biggest gains were in Island County, which saw closed sales increase 34 percent from a year ago. Kitsap, Pierce, and Skagit also had double-digit gains.
Months of supply is downright bleak for buyers across the board. Every single county had fewer months of supply this June than it did a year ago. It’s still a very strong seller’s market everywhere.
Finally, here’s a chart comparing the median price in March to the 2007 peak price in each county. King, Snohomish, and Whatcom counties have all posted prices above the previous peak, while the rest of the counties are still just barely shy of hitting that mark.
In summary: The market is still demoralizing for buyers. Oddly, it’s slightly less terrible in King County than it is everywhere else, but that’s not saying much.
If there is certain data you would like to see or ways you would like to see the data presented differently, drop a comment below and let me know.


