Get access to the full spreadsheets used to make the charts in this and other posts, as well as a variety of additional insider benefits by becoming a member of Seattle Bubble.
December market stats were published by the NWMLS yesterday afternoon. Here’s their press release:
Home buyer frustration continues
Limited selection, ongoing increases in prices and interest ratesLike many other months of 2016, December was frustrating for buyers across Washington state as they encountered depleted inventory and rising prices. Post-election hikes in interest rates – with more on the horizon — added to would-be homeowners’ worries.
…
“The housing market remains frenzy hot on a seasonal basis,” exclaimed J. Lennox Scott. Noting sales activity was substantially higher than the number of new listings, he said such conditions “continue to foster a competitive market where homebuyers are just waiting for the next new listing to come on the market.”
It must get tiring to be so pumped up all the time about overpriced homes.
NWMLS monthly reports include an undisclosed and varying number of
sales from previous months in their pending and closed sales statistics.
Here’s your King County SFH summary, with the arrows to show whether the year-over-year direction of each indicator is favorable or unfavorable news for buyers and sellers (green = favorable, red = unfavorable):
| December 2016 | Number | MOM | YOY | Buyers | Sellers |
|---|---|---|---|---|---|
| Active Listings | 1,639 | -29.0% | -7.1% |  |
 |
| Closed Sales | 2,155 | -4.2% | +4.7% |  |
 |
| SAAS (?) | 0.96 | +18.1% | -4.8% |  |
 |
| Pending Sales | 1,641 | -26.2% | +11.3%% |  |
 |
| Months of Supply | 0.76 | -25.9% | -11.3% |  |
 |
| Median Price* | $550,000 | 0.0% | +8.3% |  |
 |
Basically another terrible month for home buyers. Inventory hit an all-time low, but despite that, sales were actually up from a year ago. The one good note is that prices have been flat for the last three months. Small comfort.
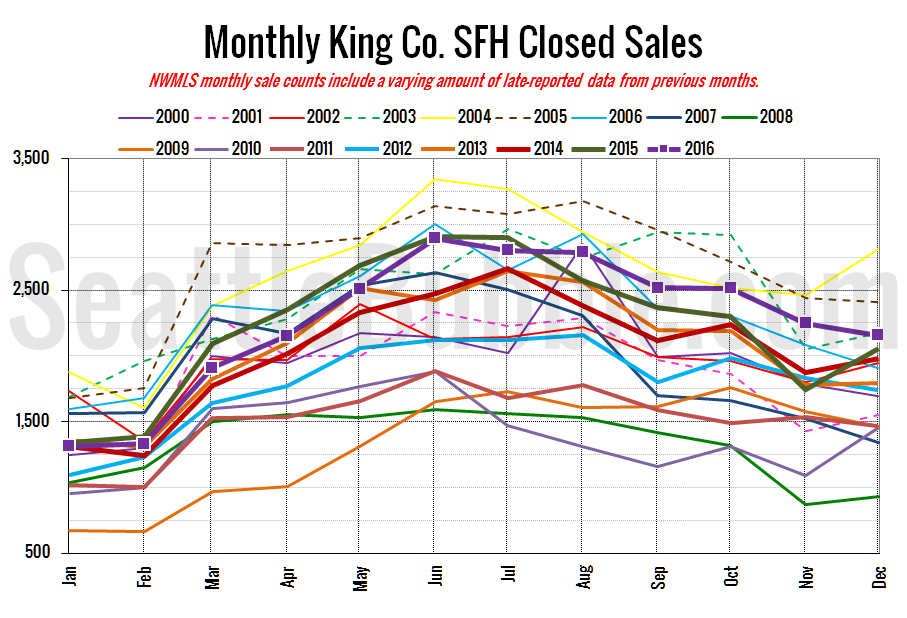
Here’s your closed sales yearly comparison chart:
Closed sales fell slightly from November to December, but were up a bit from a year ago.
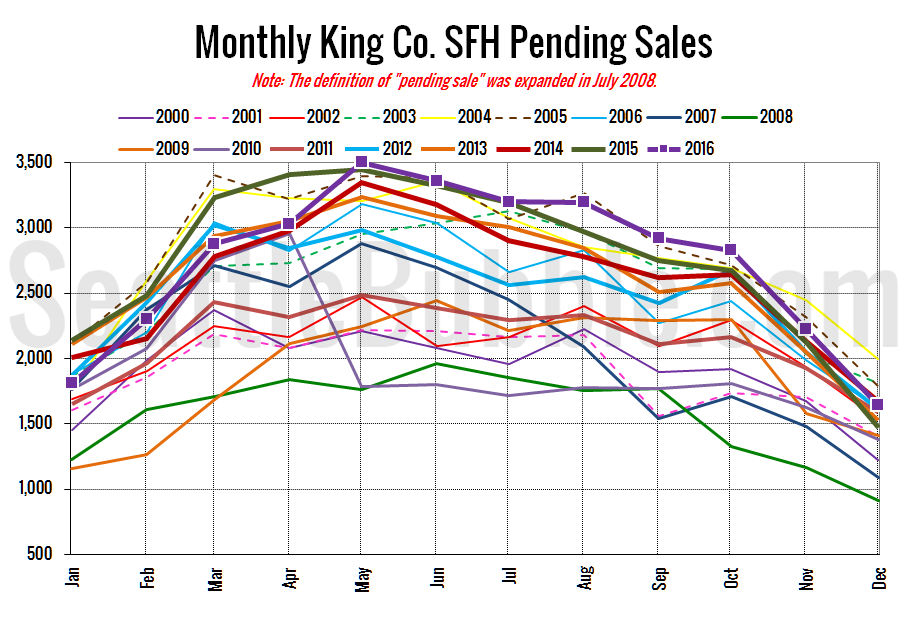
Pending sales fell twenty-six percent in December, but were also still up year-over-year, by eleven percent.
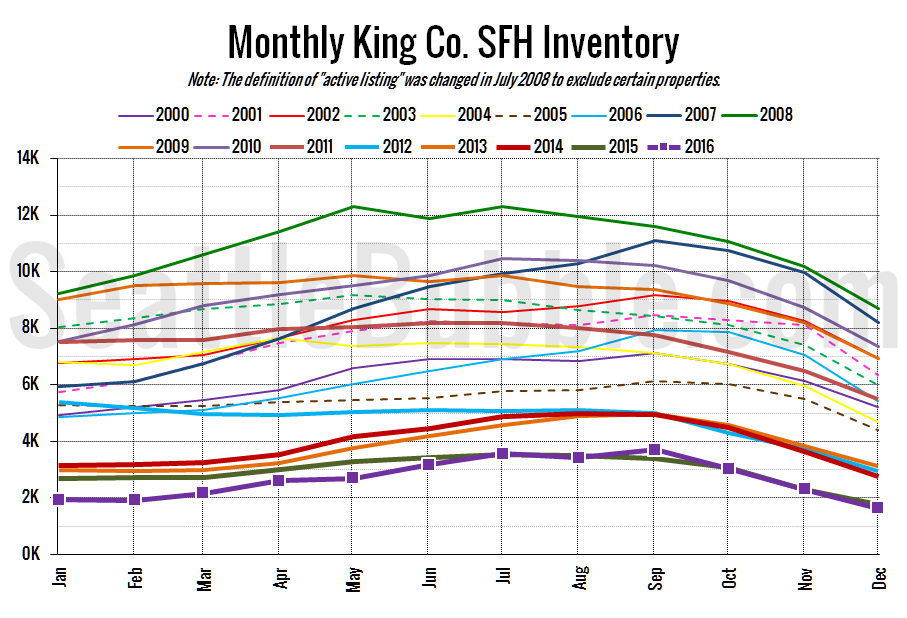
Here’s the graph of inventory with each year overlaid on the same chart.
Listings fell 29 percent from November to December, which is a fairly standard drop for this time of year. However, what is not standard is the absolute level of listings, which is now at an all-time low.
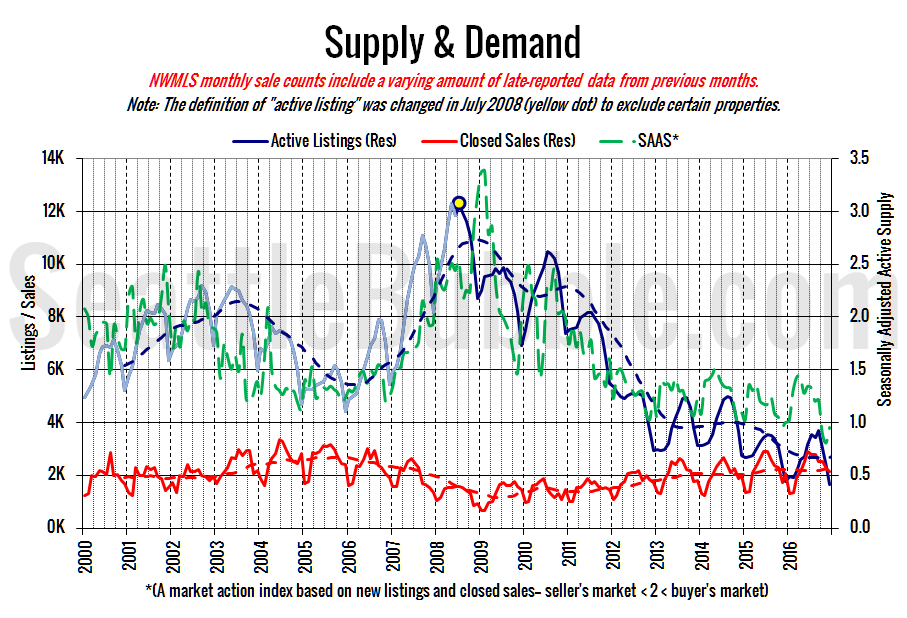
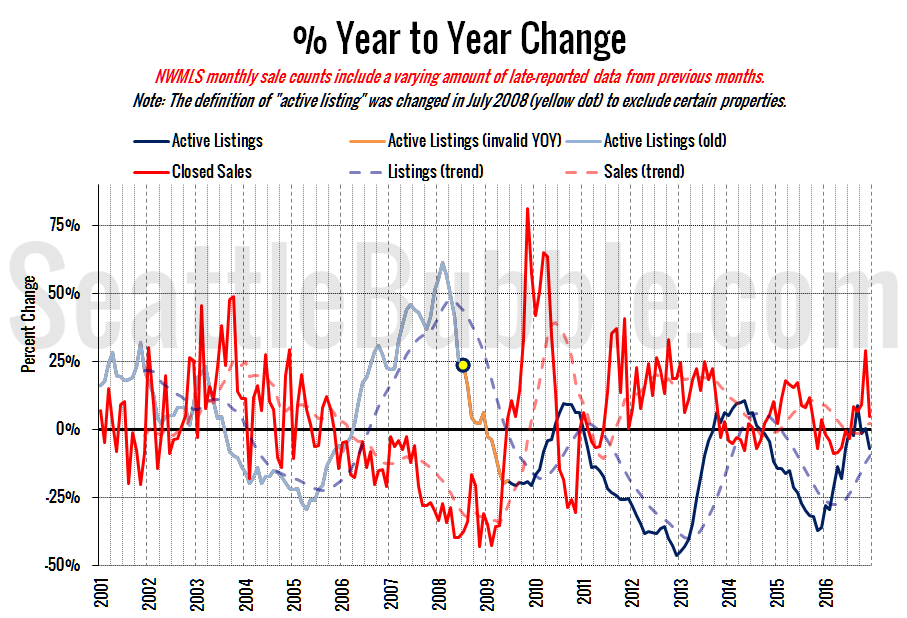
Here’s the supply/demand YOY graph. “Demand” in this chart is represented by closed sales, which have had a consistent definition throughout the decade (unlike pending sales from NWMLS).
At least the demand line in this chart moved closer to zero instead of powering even higher. Still strongly in seller’s market territory, but at least not getting worse.
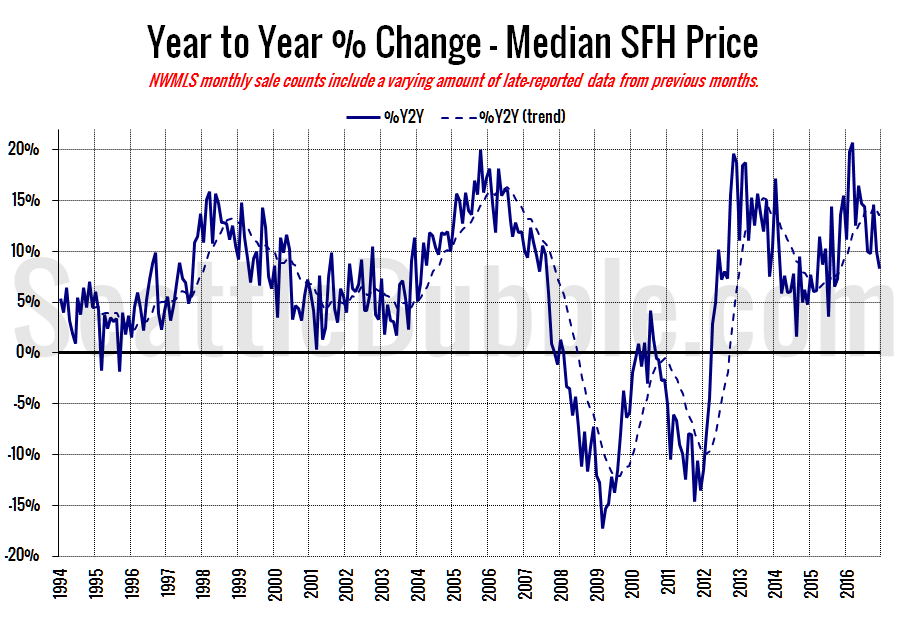
Here’s the median home price YOY change graph:
Year-over-year home price gains fell from nearly fifteen percent in October to ten percent in November, to eight percent in December.
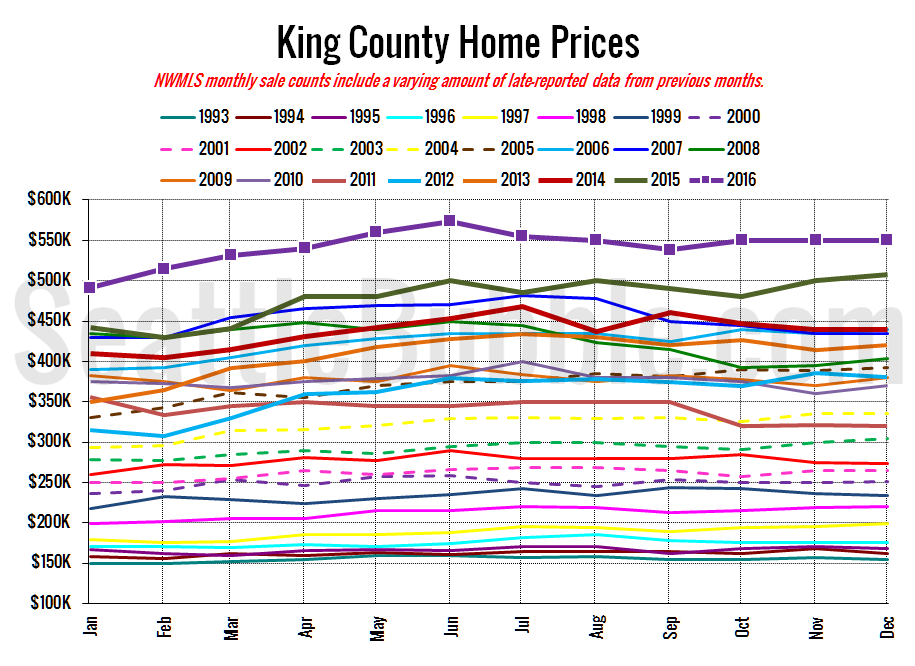
And lastly, here is the chart comparing King County SFH prices each month for every year back to 1994 (not adjusted for inflation).
Given the extreme lack of inventory, it is somewhat surprising that home prices have stayed flat the last few months.
December 2016: $550,000
July 2007: $481,000 (previous cycle high)
Here’s the article from the Seattle Times: Seattle-area home pickings slimmer than ever: high demand, limited supply
