Get access to the full spreadsheets used to make the charts in this and other posts, as well as a variety of additional insider benefits by becoming a member of Seattle Bubble.
February market stats have been published by the NWMLS this week. Here’s their press release.
Housing Inventory Reaches Record Low
Home buyers are in a spring mood, but sellers are still hibernating, suggested one broker while commenting about the latest statistics from Northwest Multiple Listing Service. Figures for February and feedback from brokers indicate record-low inventory is spurring multiple offers, rising prices, fewer sales, and frustrated house-hunters.
…
“Our robust market has created extreme conditions, and we’re seeing frenzy hot activity on each new listing coming on the market,” reported J. Lennox Scott, chairman and CEO of John L. Scott. “We’re also experiencing some of the lowest inventory levels on record,” he noted.
Frenzy hot! Mad hot! Crazy hot! Hot hot HOT!
NWMLS monthly reports include an undisclosed and varying number of
sales from previous months in their pending and closed sales statistics.
Here’s your King County SFH summary, with the arrows to show whether the year-over-year direction of each indicator is favorable or unfavorable news for buyers and sellers (green = favorable, red = unfavorable):
| February 2017 | Number | MOM | YOY | Buyers | Sellers |
|---|---|---|---|---|---|
| Active Listings | 1,434 | -8.6% | -25.4% |  |
 |
| Closed Sales | 1,351 | -14.6% | +1.6% |  |
 |
| SAAS (?) | 1.13 | +41.2% | -12.8% |  |
 |
| Pending Sales | 2,084 | +7.5% | -9.4% |  |
 |
| Months of Supply | 1.06 | +7.0% | -26.6% |  |
 |
| Median Price* | $560,000 | +5.7% | +14.1% |  |
 |
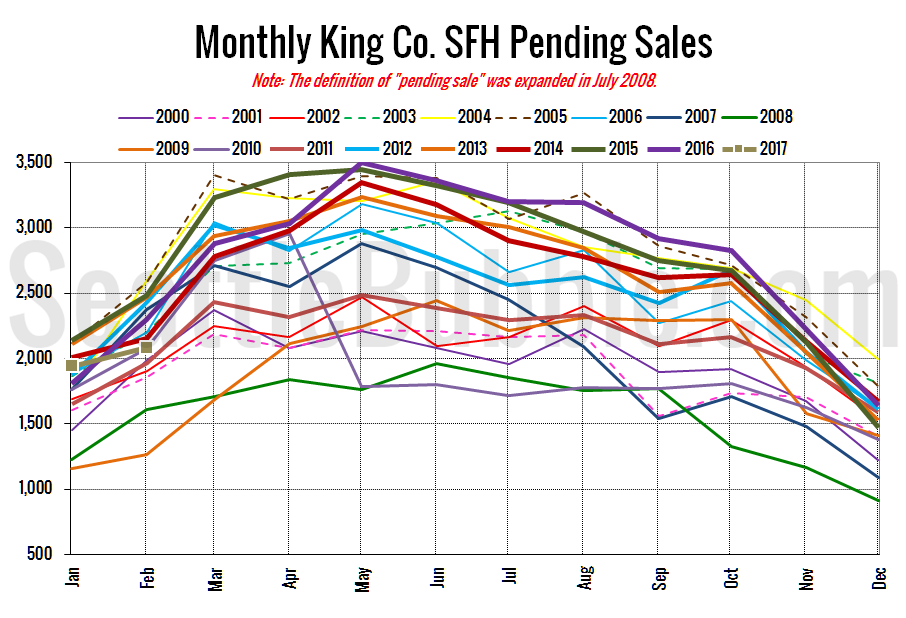
The only glimmer of hope for buyers in this month’s numbers is the year-over-year decline in pending sales. Last year pending sales shot up 27 percent between January and February, but this year they only rose seven percent.
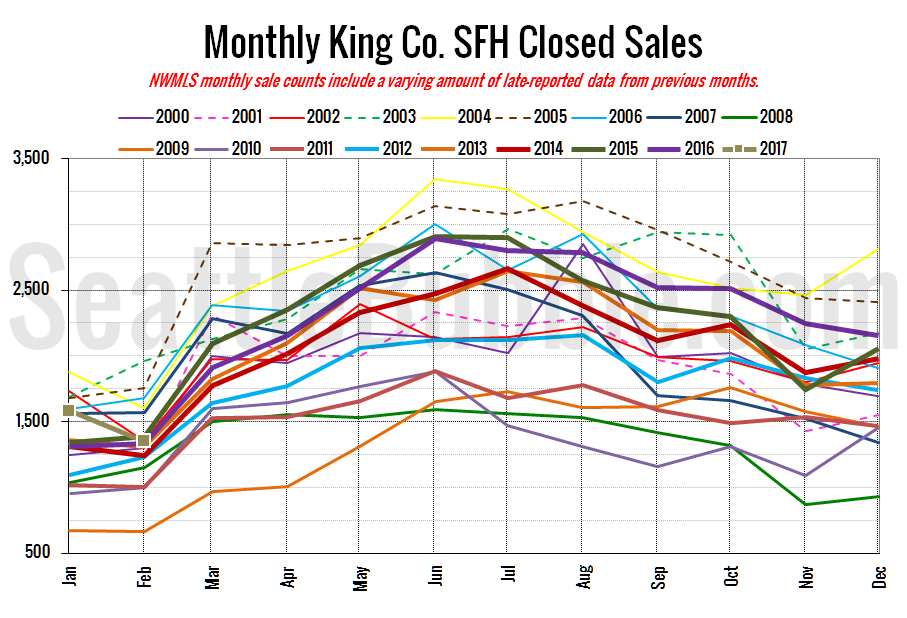
Here’s your closed sales yearly comparison chart:
Closed sales fell 15 percent from January to February. Last year over the same period closed sales actually rose one percent, so we’re definitely seeing some weakness in sales. That said, closed sales were still up slightly from a year ago (+1.6%).
As mentioned earlier, pending sales rose seven percent in February, but were down nine percent year-over-year.
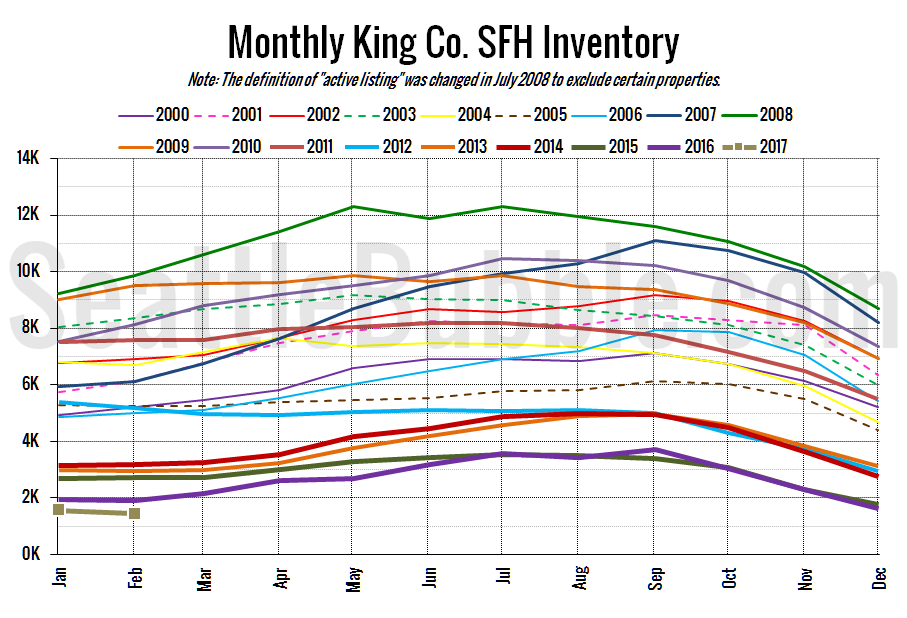
Here’s the graph of inventory with each year overlaid on the same chart.
Listings fell nine percent from January to February, the largest decrease between those months on record. The previous record was a four percent drop in 2012. On average between 2000 and 2016 listings rose two percent. In other words, the change in listings last month is generally just terrible for anyone hoping to see more homes on the market.
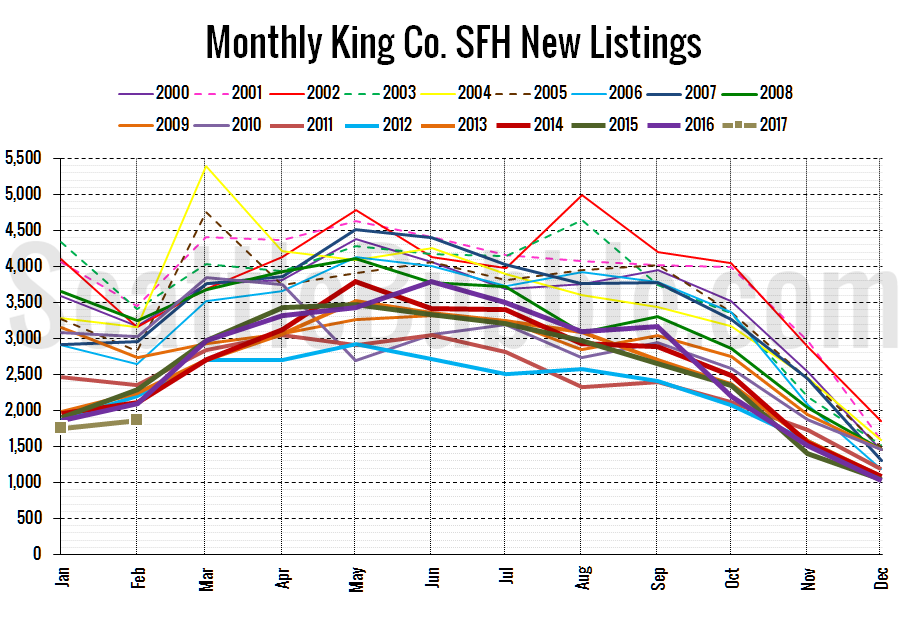
Just to drive home the point of how terrible inventory is, here’s the chart of new listings:
Inventory isn’t just low because all the new listings are being sold quickly. There just aren’t many new listings coming on the market.
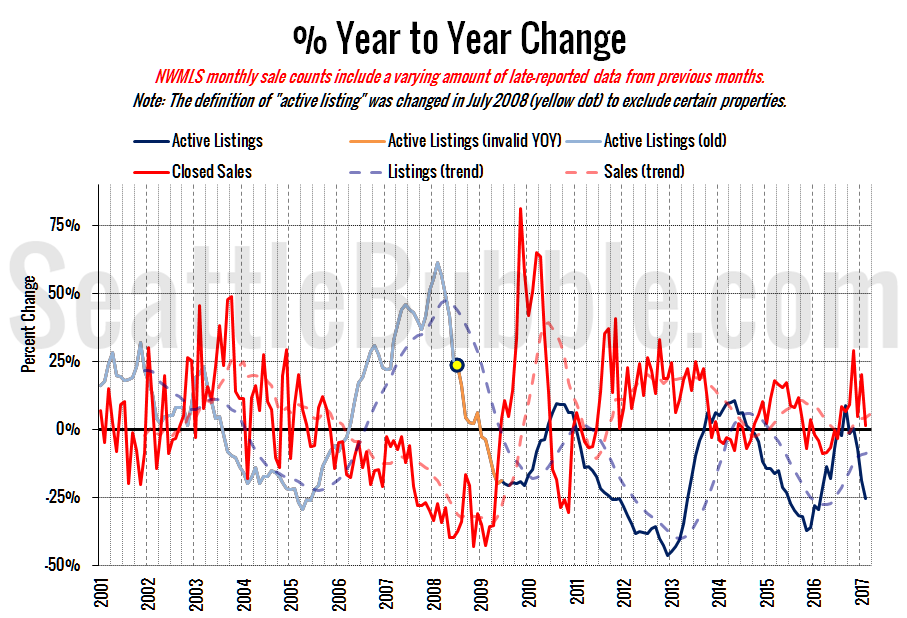
Here’s the supply/demand YOY graph. “Demand” in this chart is represented by closed sales, which have had a consistent definition throughout the decade (unlike pending sales from NWMLS).
Everything is still strongly in seller’s market territory.
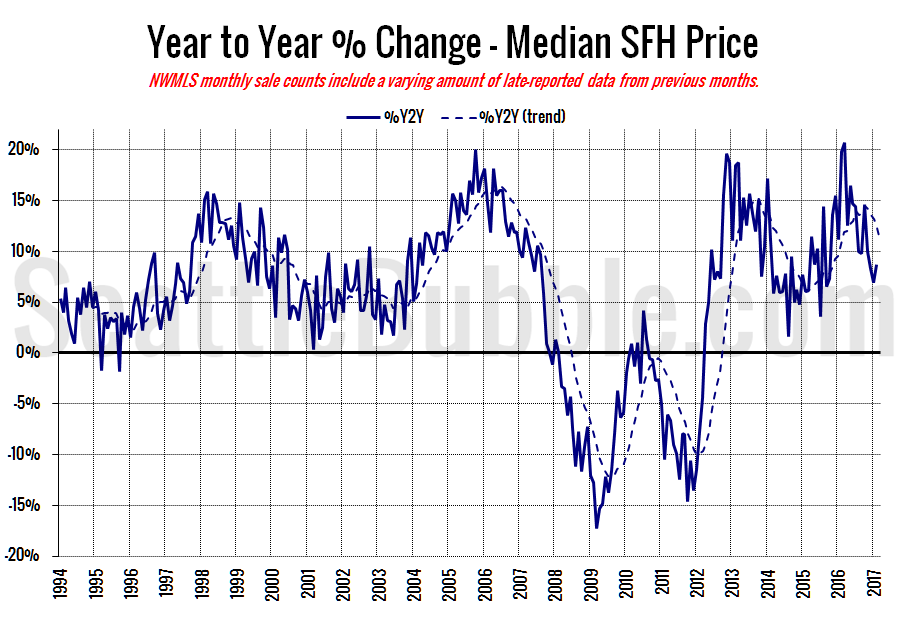
Here’s the median home price YOY change graph:
Year-over-year home price gains inched up slightly from January to February, but are still below ten percent.
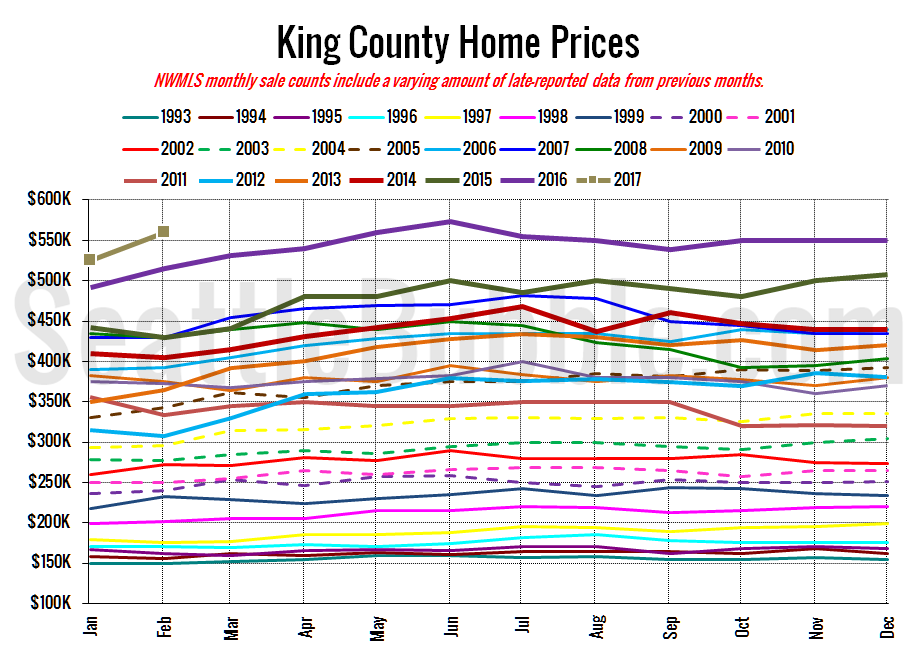
And lastly, here is the chart comparing King County SFH prices each month for every year back to 1994 (not adjusted for inflation).
Still looks like we’re likely to hit new highs in just a few months.
February 2017: $560,000
July 2007: $481,000 (previous cycle high)
Here’s the article from the Seattle Times: Seattle and Eastside home prices, after brief slowdown, surge to record highs
