Get access to the full spreadsheets used to make the charts in this and other posts, as well as a variety of additional insider benefits by becoming a member of Seattle Bubble.
February market stats have been published by the NWMLS this week. Here’s their press release.
NWMLS brokers report 50 percent spike in new listings
“Although we’re seeing better news for buyers related to increases in new listings during the past three months, we’re continuing to sell inventory at a faster rate,” stated Mike Grady, president and COO of Coldwell Banker Bain. “This lack of supply continues to put an upward pressure on home prices. We’re in for yet another frenzied spring,” he believes.
…
“It’s a straight up crazy, frenzy market in King and Snohomish counties,” said J. Lennox Scott, chairman and CEO of John L. Scott. About 75 percent of homes are selling within the first 30 days, according to his analysis.
I love how in last month’s post I jokingly used “crazy hot” to refer Lennox’s obvious excitement over frothing prices, and this month he actually says it.
What I don’t love is the absurd market we now find ourselves in. I suppose if I wanted to sell my house and leave the Seattle area, it would be awesome, but for most people in the area it stinks.
NWMLS monthly reports include an undisclosed and varying number of
sales from previous months in their pending and closed sales statistics.
Here’s your King County SFH summary, with the arrows to show whether the year-over-year direction of each indicator is favorable or unfavorable news for buyers and sellers (green = favorable, red = unfavorable):
| March 2017 | Number | MOM | YOY | Buyers | Sellers |
|---|---|---|---|---|---|
| Active Listings | 1,703 | +18.8% | -21.0% |  |
 |
| Closed Sales | 2,079 | +53.9% | +8.8% |  |
 |
| SAAS (?) | 1.27 | +12.3% | -11.4% |  |
 |
| Pending Sales | 2,723 | +30.7% | -5.4% |  |
 |
| Months of Supply | 0.82 | -22.8% | -27.5% |  |
 |
| Median Price* | $599,950 | +7.1% | +12.9% |  |
 |
For the second month in a row, the only “good news” for buyers in this month’s numbers is the year-over-year decline in pending sales. Interestingly, although pending sales have been down year-over-year for two months in a row now, closed sales continued to increase year-over-year.
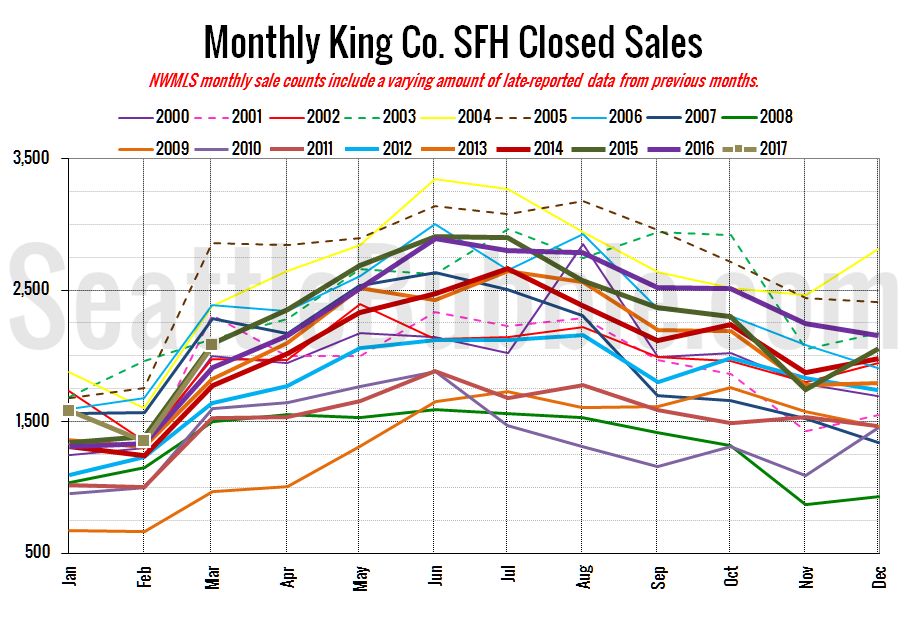
Here’s your closed sales yearly comparison chart:
Closed sales shot up 54 percent from February to March. Last year over the same period closed sales rose 44 percent, so while this was a strong increase it was slightly less of a seasonal bump than last year. Despite that, year-over-year closed sales increased from up two percent in February to up nine percent in March.
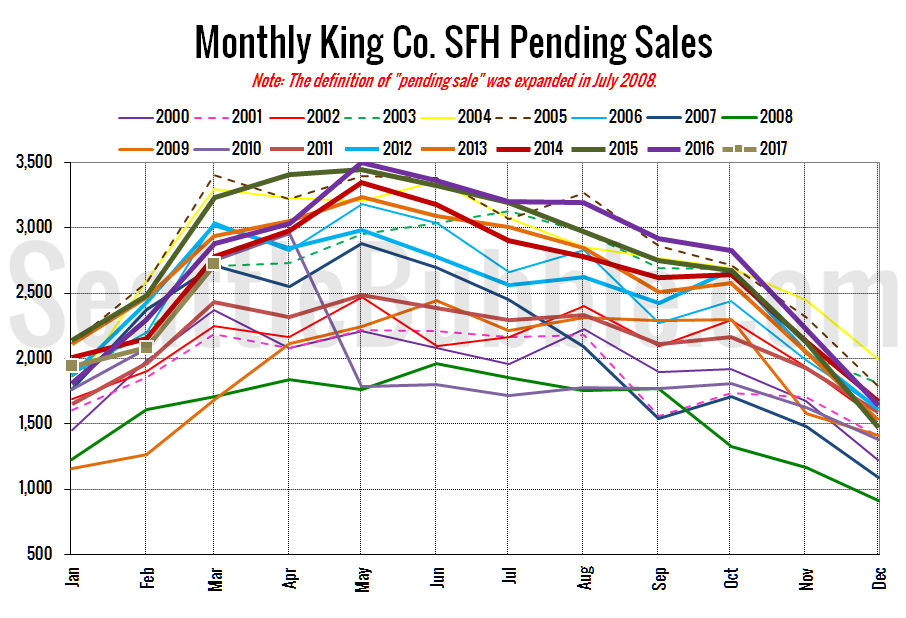
Pending sales rose 31 percent from February to March, but were down five percent year-over-year.
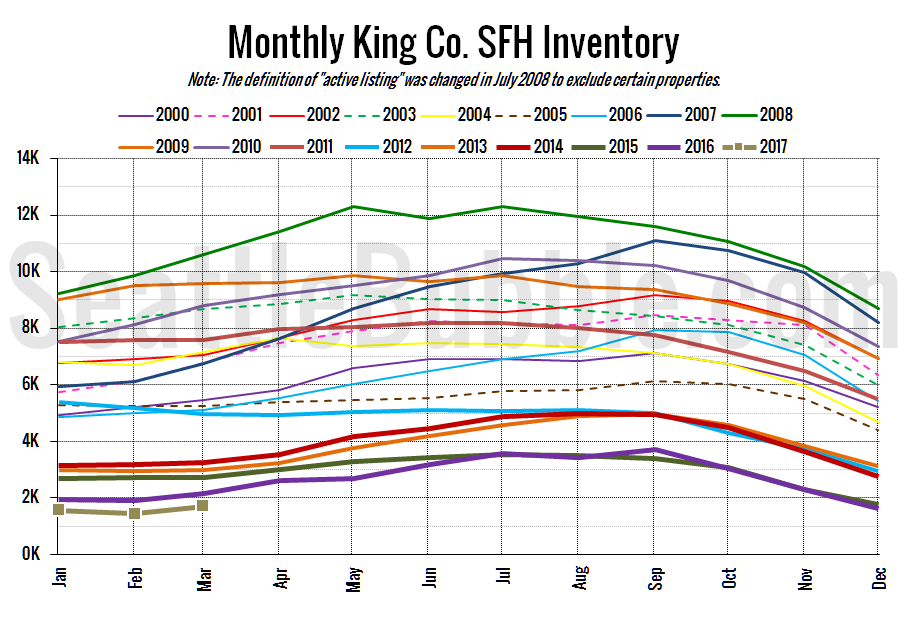
Here’s the graph of inventory with each year overlaid on the same chart.
Listings rose 19 percent from February to March, which is a larger increase than the 12 percent gain we saw last year. Still though, year-over-year listings were down 21 percent.
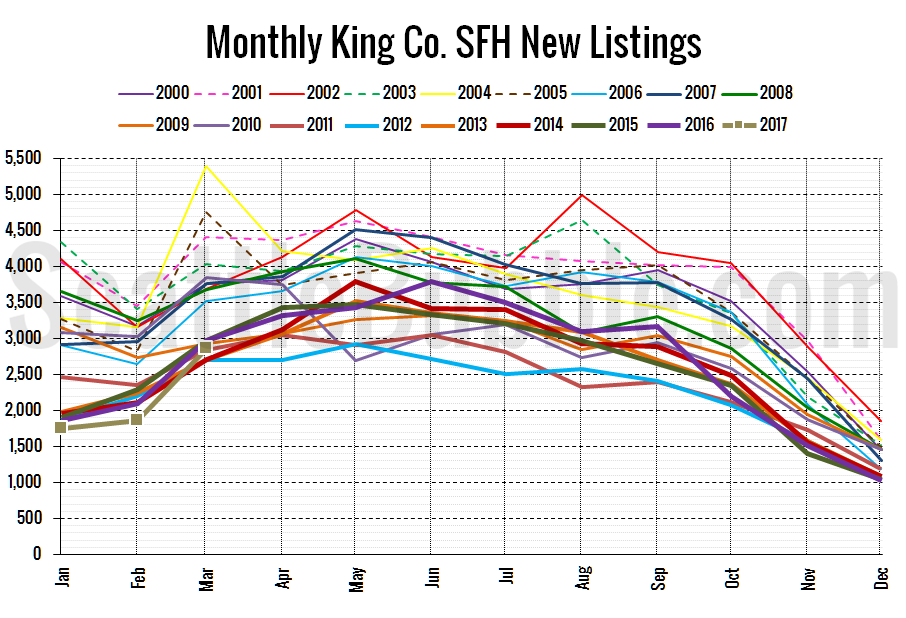
Here’s the chart of new listings:
We’re not setting new record lows anymore, so that’s good. Still though, the number of new listings fell slightly short of last year’s level.
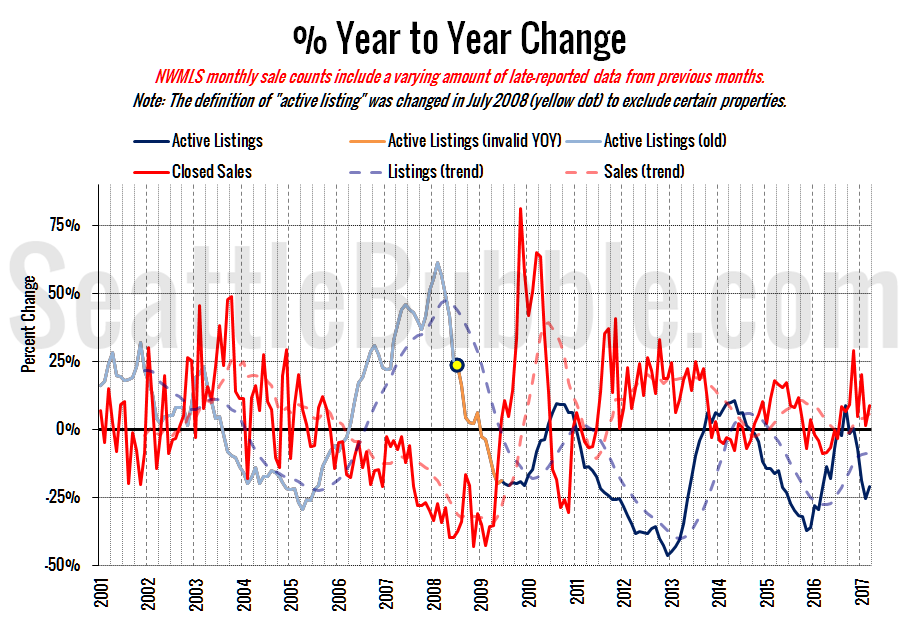
Here’s the supply/demand YOY graph. “Demand” in this chart is represented by closed sales, which have had a consistent definition throughout the decade (unlike pending sales from NWMLS).
No big change here, it is still a very strong sellers’ market out there.
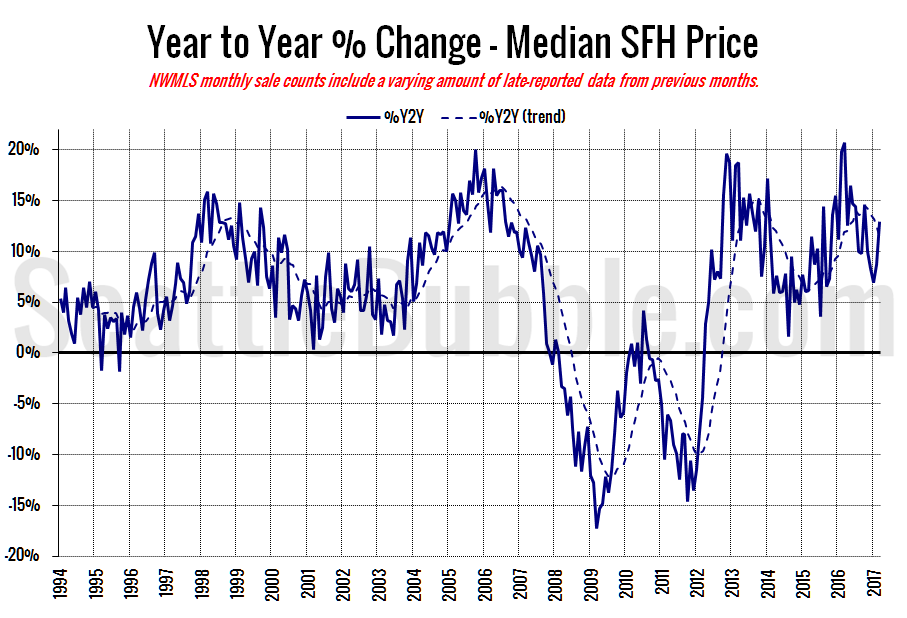
Here’s the median home price YOY change graph:
Back up into double digits. We’ll take a look later this month at how sales were distributed throughout the county, which is often a large driver of big month-to-month changes in the median price.
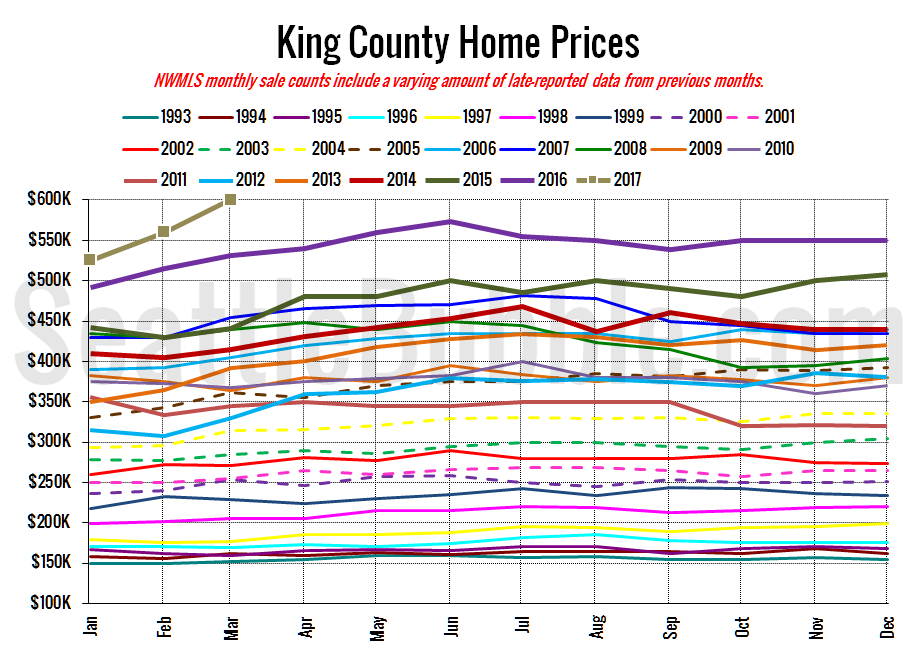
And lastly, here is the chart comparing King County SFH prices each month for every year back to 1994 (not adjusted for inflation).
Well, I said we were likely to hit new highs soon, and now we have. Looks like we’ll have to adjust the scale on that chart very soon.
March 2017: $599,950
July 2007: $481,000 (previous cycle high)
Here’s the article from the Seattle Times: Seattle’s median home price hits record: $700,000, double 5 years ago
