Get access to the full spreadsheets used to make the charts in this and other posts, as well as a variety of additional insider benefits by becoming a member of Seattle Bubble.
October market stats have been published by the NWMLS. Here’s a quick excerpt from their press release:
Key indicators for Western Washington housing still rising, but brokers detect slowdown and uncertainty
Early seasonal snow and questions swirling around the tax plan unveiled last week by House Republicans could make the usual seasonal slowdown more pronounced, say industry leaders from Northwest Multiple Listing Service. For October, however, key indicators trended upwards.
…
“The challenge for buyers actually isn’t lack of choice, it is the rapid pace of sales,” suggested Ken Anderson, president/owner of Coldwell Banker Evergreen Olympic Realty.
…
J. Lennox Scott, chairman and CEO of John L. Scott Real Estate, noted October was the “best ever for sales activity in the Puget Sound region.”
…
Compared to spring months, Scott expects volumes in the next few months will be at 30-to-50 percent of spring totals. “The stage is set once again for a frenzy housing market after the first of the year in the price ranges where there is a shortage of active listings for sale.”
Lennox sure likes that word “frenzy.” He seems to think that it has positive connotations. Personally I think it’s exactly the opposite. People do irrational and stupid things in a frenzy that they usually regret later. Is he saying that’s true of the current housing market? Maybe we actually agree more than I thought…
Now let’s dive into the numbers for October.
NWMLS monthly reports include an undisclosed and varying number of
sales from previous months in their pending and closed sales statistics.
Here’s your King County SFH summary, with the arrows to show whether the year-over-year direction of each indicator is favorable or unfavorable news for buyers and sellers (green = favorable, red = unfavorable):
| October 2017 | Number | MOM | YOY | Buyers | Sellers |
|---|---|---|---|---|---|
| Active Listings | 2,619 | -15.6% | -13.4% |  |
 |
| Closed Sales | 2,441 | -2.8% | -2.9% |  |
 |
| SAAS (?) | 1.03 | -11.7% | +14.3% |  |
 |
| Pending Sales | 2,760 | +0.9% | -2.4% |  |
 |
| Months of Supply | 1.07 | -13.2% | -10.8% |  |
 |
| Median Price* | $630,000 | +0.8% | +14.5% |  |
 |
The only tiny shred of kind-of good news for buyers is that closed sales and pending sales are down slightly from a year ago. Of course, listings are down considerably more than sales, so the market overall is still trending in sellers’ favor.
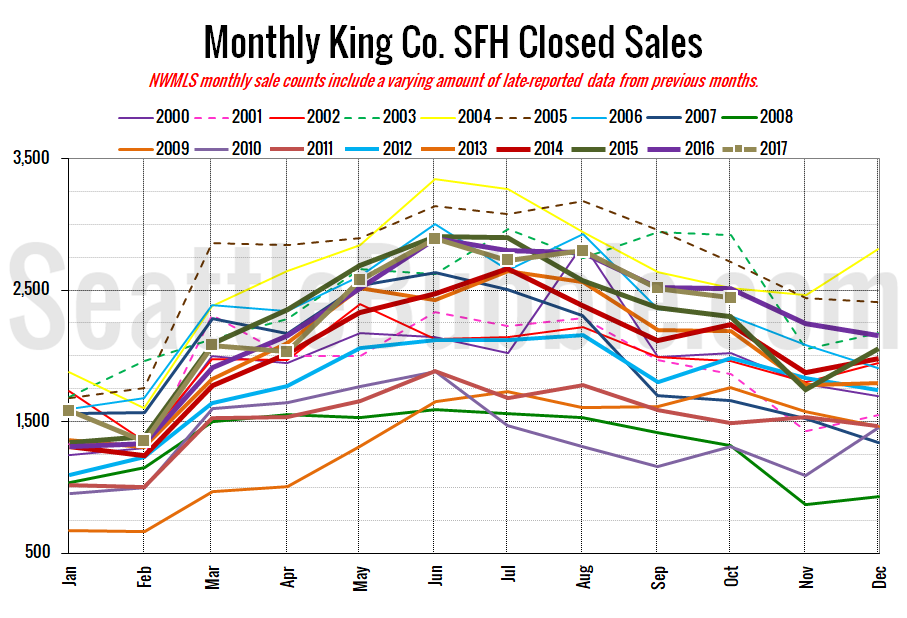
Here’s your closed sales yearly comparison chart:
Closed sales fell three percent between September and October. Last year over the same period closed sales were down just a tenth of a percent. Year-over-year closed sales were down three percent.
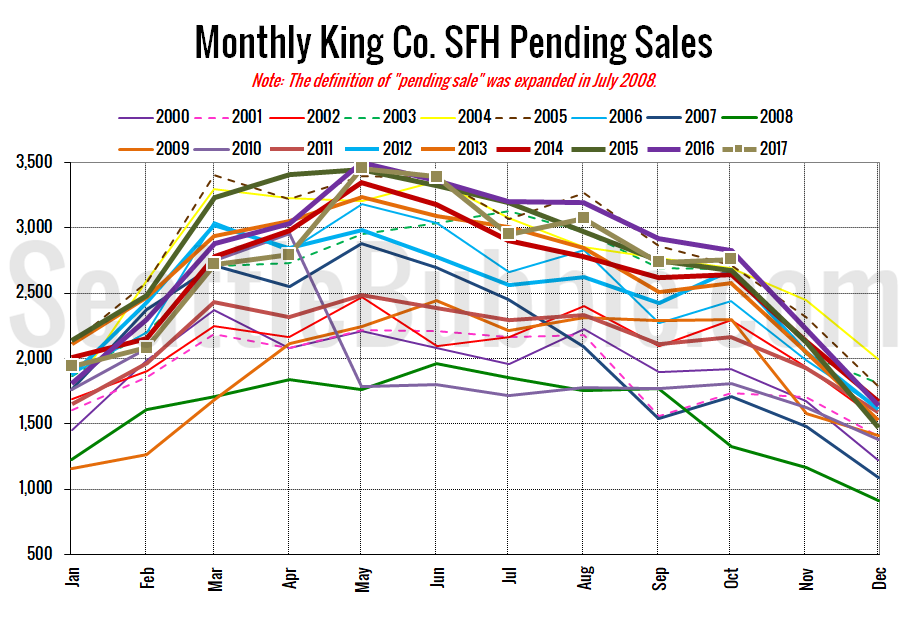
Pending sales were up one percent from September to October, and were down two percent year-over-year. Year-to-date pending sales are down four percent from 2016. Meanwhile year-to-date closed sales are up one percent. I still don’t know exactly why that’s happening, but my guess would be that fewer pending sales are collapsing this year than last year.
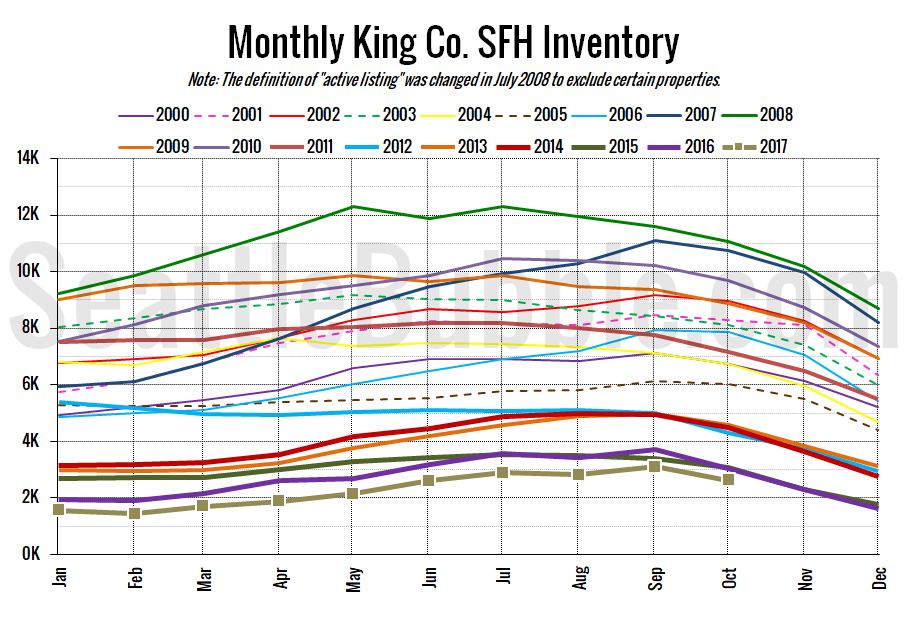
Here’s the graph of inventory with each year overlaid on the same chart.
Inventory fell sixteen percent from September to October, and was down about the same amount from last year.
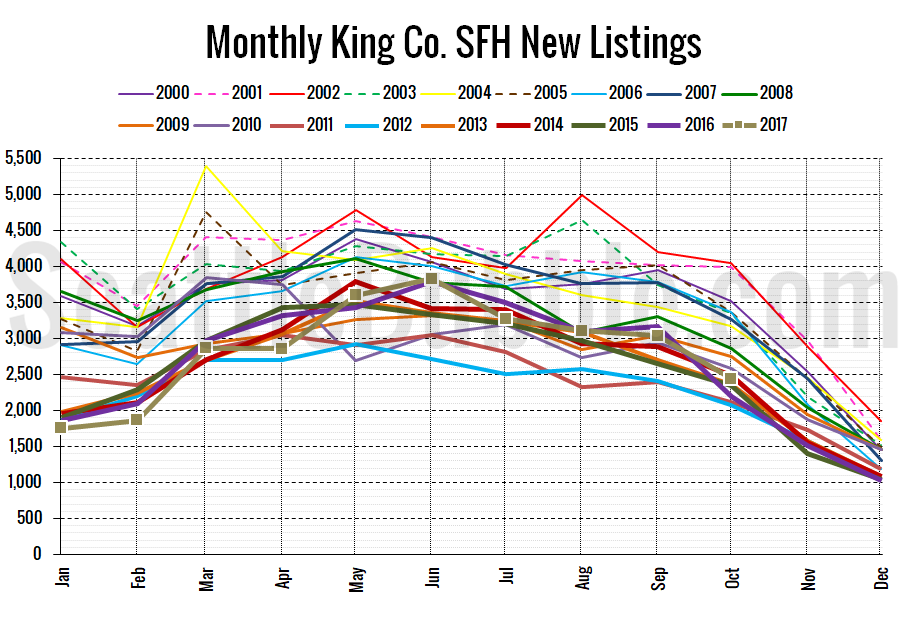
Here’s the chart of new listings:
One tiny bit of good news: new listings were up eleven percent from a year ago.
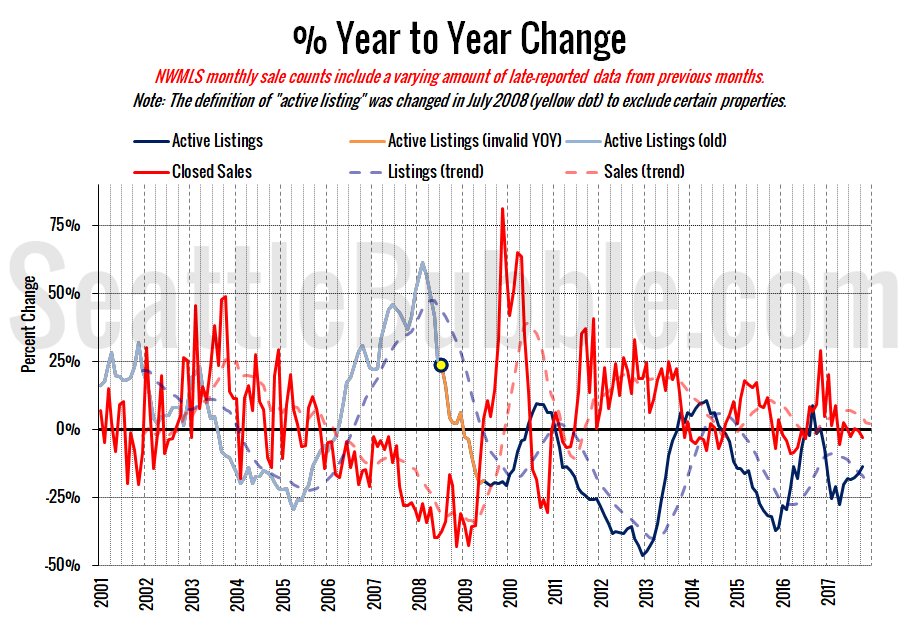
Here’s the supply/demand YOY graph. “Demand” in this chart is represented by closed sales, which have had a consistent definition throughout the decade (unlike pending sales from NWMLS).
Still nothing new here. It seems like it’s been the same story forever: It’s a great time to be a seller and a terrible time to be a buyer.
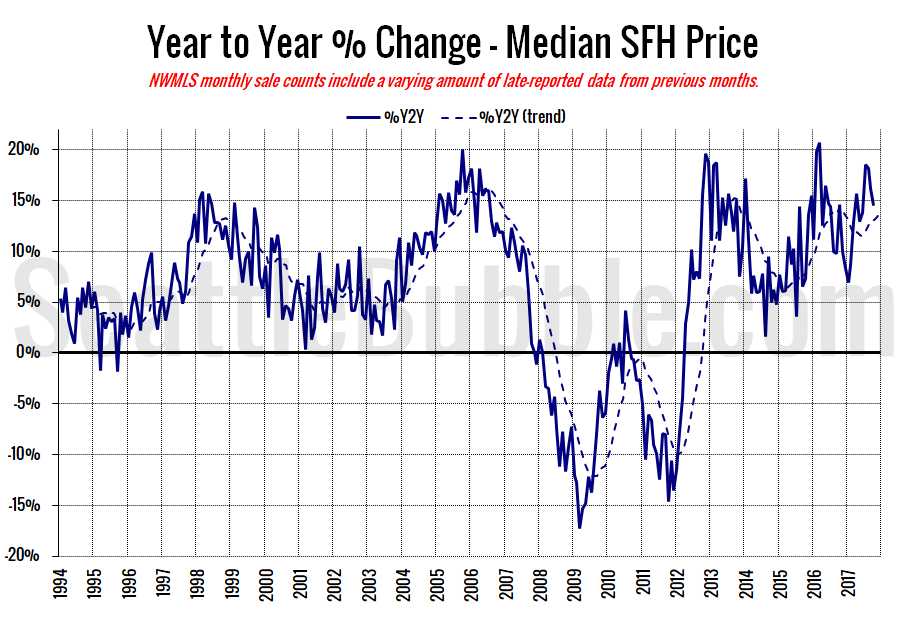
Here’s the median home price YOY change graph:
Year-over-year price changes fell a couple points between September and October and are still sit at a very high level.
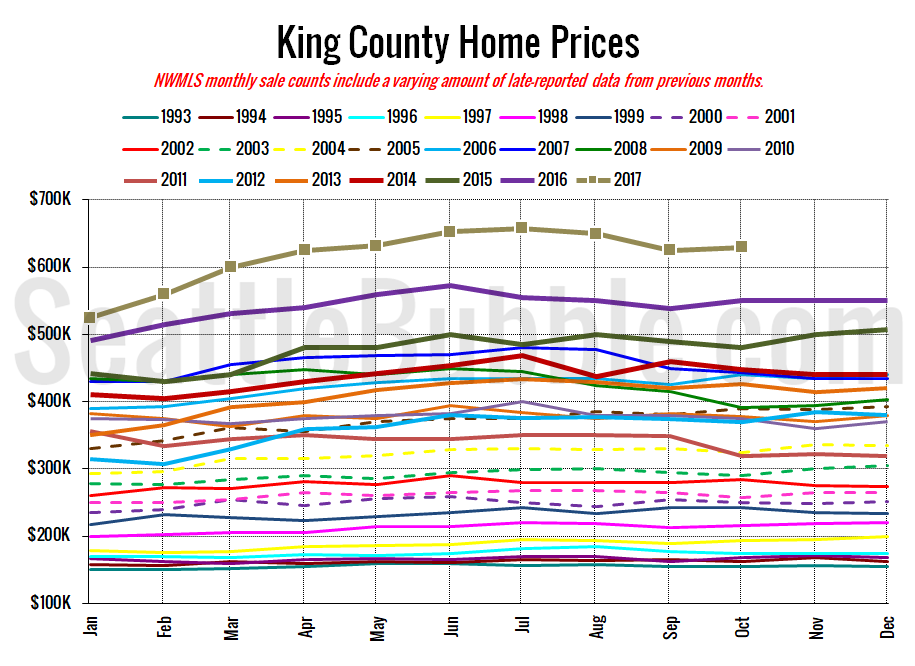
And lastly, here is the chart comparing King County SFH prices each month for every year back to 1994 (not adjusted for inflation).
Up slightly from September, but not quite back to the all-time high hit in July.
October 2017: $630,000
July 2007: $481,000 (previous cycle high)
Here’s the article from the Seattle Times: Seattle home prices jump nearly 18 percent; West Bellevue median hits $2.6 million
