Get access to the full spreadsheets used to make the charts in this and other posts, as well as a variety of additional insider benefits by becoming a member of Seattle Bubble.
December market stats have been published by the NWMLS. Here’s a quick excerpt from their press release:
“Exceptionally Low” Inventory Slows Year-End Home Sales, Contributes to Steep Price Hikes around Greater Seattle region
“While all year we’ve been bemoaning lack of inventory and escalating prices, the statistics show 2017 was a banner year in many respects for real estate in the Puget Sound region and throughout the Northwest,” stated Mike Grady, president and COO of Coldwell Banker Bain. He cited year-over-year gains in both prices and values, commenting “As a result of this strong market, homeowners are experiencing bountiful gains in property values.”
Brokers expect momentum to continue despite uncertainty about interest rates and taxes.
J. Lennox Scott, chairman and CEO of John L. Scott Real Estate believes the Central Puget Sound housing market will remain one of the strongest in the nation. “It will be another happy new year for real estate activity.” As the new year unfolds, he expects buyers “will emerge from winter holiday hibernation in big numbers” in part thanks to the Seahawks. “Without the Seahawks in the football playoffs, the 2018 housing market will be more intense earlier in January rather than heating up after the Super Bowl,” Scott remarked.
Scott also anticipates a “frenzied, multiple-offer market” in the more affordable and mid-price ranges, as well as “good-to-strong” sales activity in the luxury market close to the job centers. Positive job growth and attractive interest rates will propel activity, he suggests, adding “In the more affordable and mid-price ranges, the impact of the new federal tax policy is minimal.”
Literally nobody puts off buying a house just because of a few weeks of playoff football. What a stupid thing to suggest. Also, I seriously think Lennox used the word “frenzy” in literally every single monthly NWMLS news release in 2017. He’s having a “frenzy” frenzy.
Now let’s dive into the numbers for December.
NWMLS monthly reports include an undisclosed and varying number of
sales from previous months in their pending and closed sales statistics.
Here’s your King County SFH summary, with the arrows to show whether the year-over-year direction of each indicator is favorable or unfavorable news for buyers and sellers (green = favorable, red = unfavorable):
| December 2017 | Number | MOM | YOY | Buyers | Sellers |
|---|---|---|---|---|---|
| Active Listings | 1,168 | -37.8% | -28.7% |  |
 |
| Closed Sales | 2,094 | -5.8% | -2.8% |  |
 |
| SAAS (?) | 0.86 | -1.7% | -10.2% |  |
 |
| Pending Sales | 1,459 | -34.1% | -11.1% |  |
 |
| Months of Supply | 0.56 | -34.0% | -26.7% |  |
 |
| Median Price* | $635,000 | +0.7% | +15.5% |  |
 |
This is the lowest level on record (going back to 2000) for months of supply. The previous record low was December 2016 at 0.76, and the record low before that was December 2015 at 0.86. Supply and demand have never been as far out of balance in the Seattle area as they are right now.
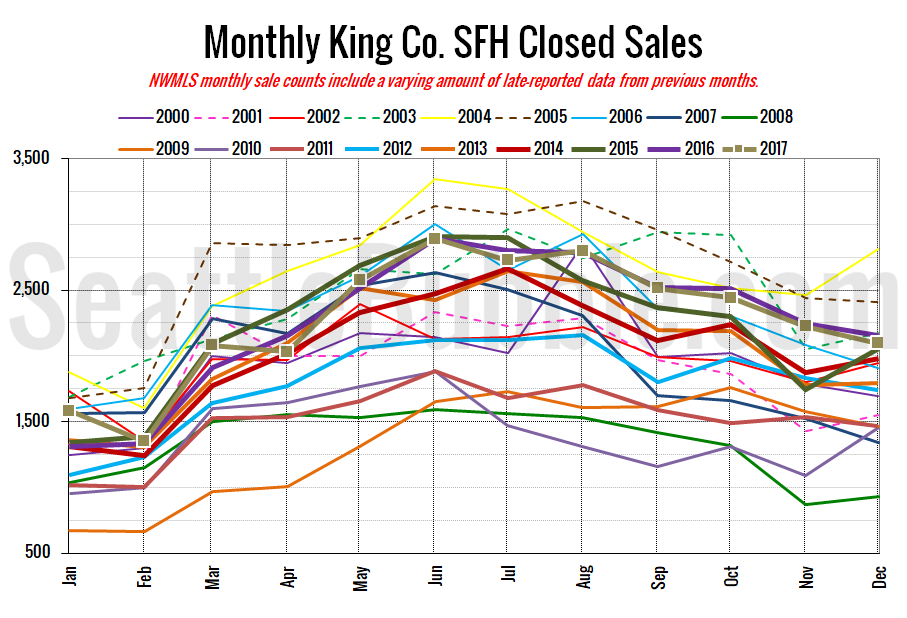
Here’s your closed sales yearly comparison chart:
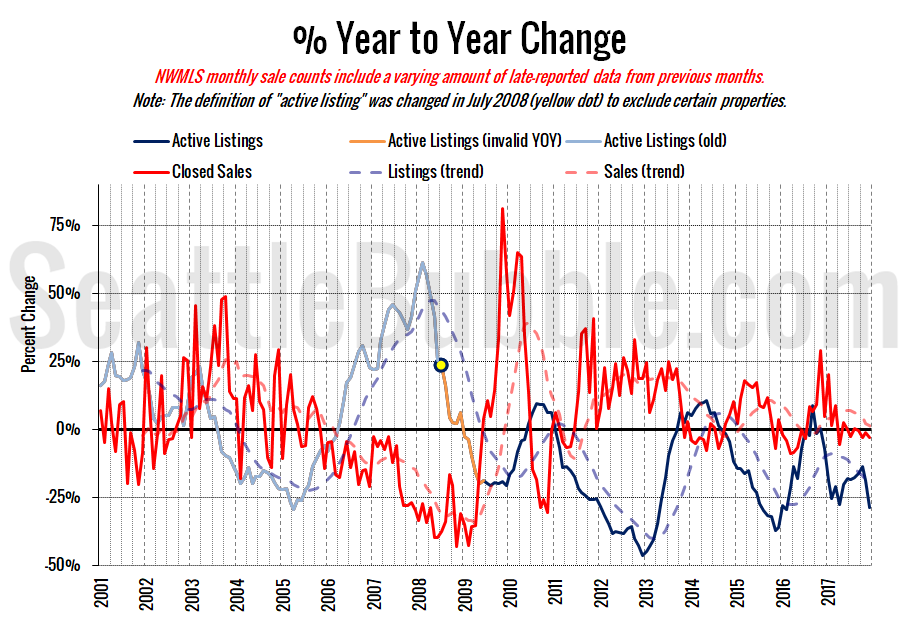
Closed sales fell six percent between November and December. Last year over the same period closed sales were down four percent. Year-over-year closed sales were down three percent, which is an astoundingly small decline given how few listings there have been.
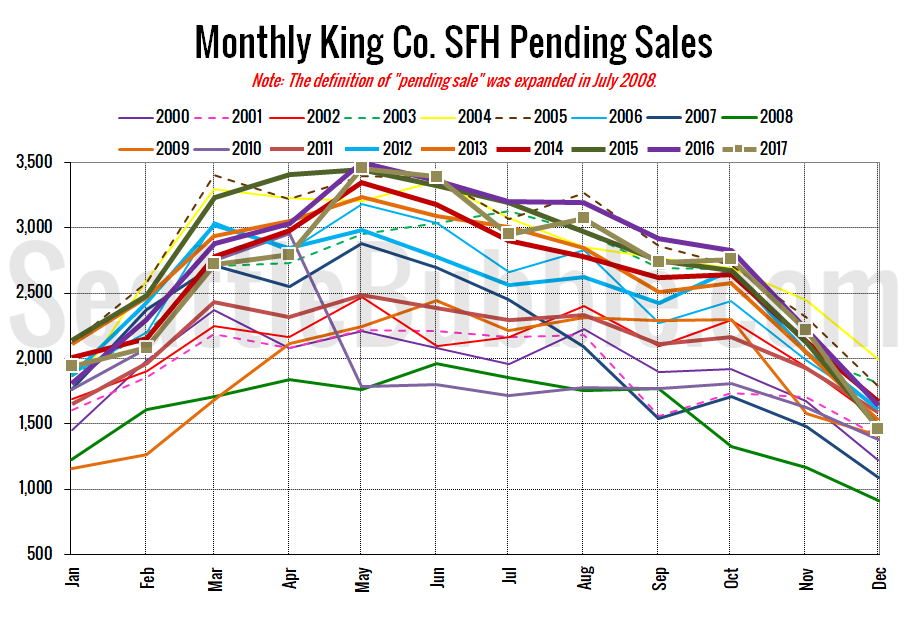
Pending sales were down 34 percent from November to December, and were down eleven percent year-over-year.
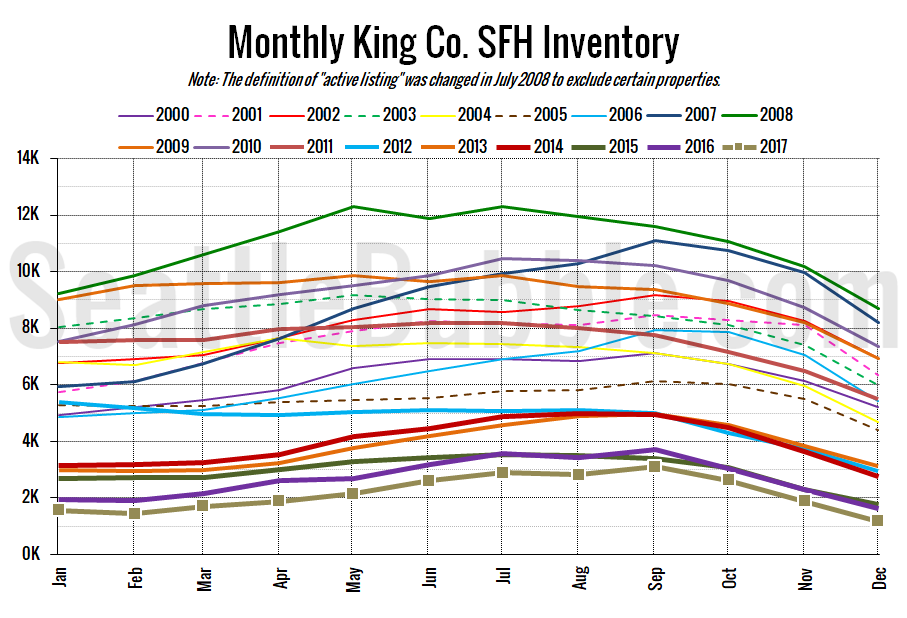
Here’s the graph of inventory with each year overlaid on the same chart.
Inventory fell 38 percent from November to December, and was down 29 percent from last year. Total on-market listings are at an all-time low.
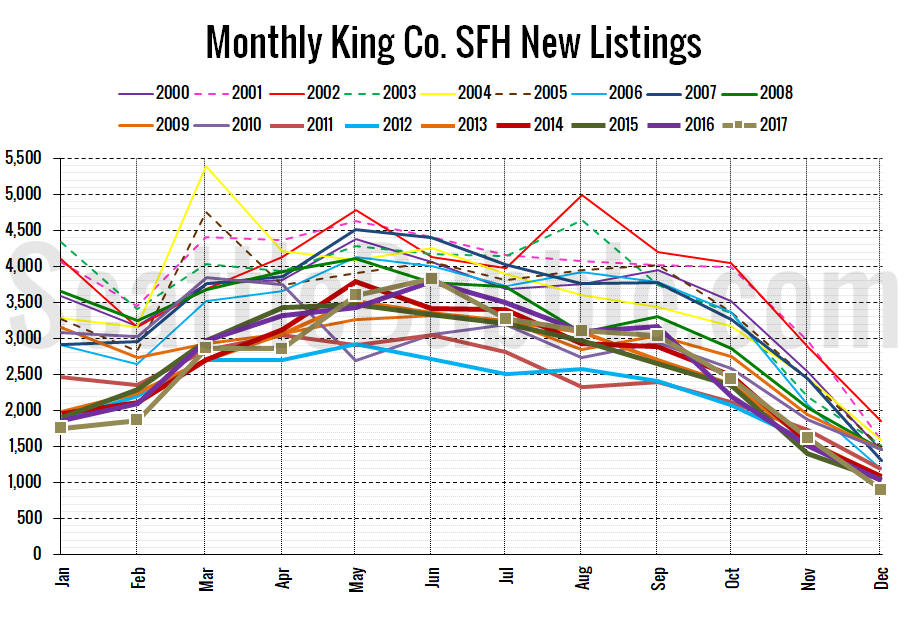
Here’s the chart of new listings:
New listings were also down from a year ago, falling 13 percent.
For the whole of 2017, new listings were down 2.7 percent from the whole of 2016, while pending sales were down 4.0 percent.
Here’s the supply/demand YOY graph. “Demand” in this chart is represented by closed sales, which have had a consistent definition throughout the decade (unlike pending sales from NWMLS).
I wish there were some change here but it’s the same story as it has been for a while. Bad news for buyers, great news for sellers.
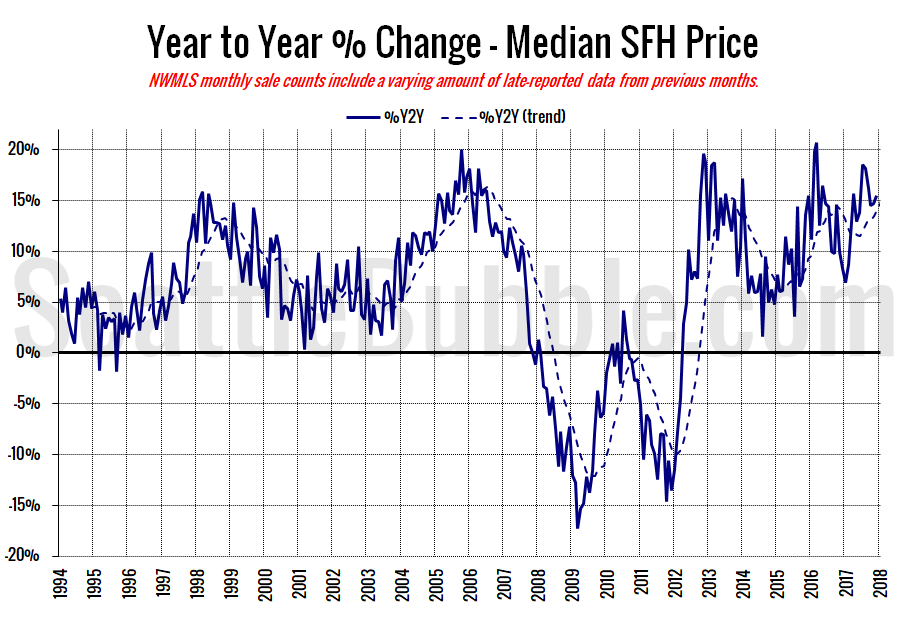
Here’s the median home price YOY change graph:
Year-over-year price changes have been edging up over the last few months, to 15 percent in December.
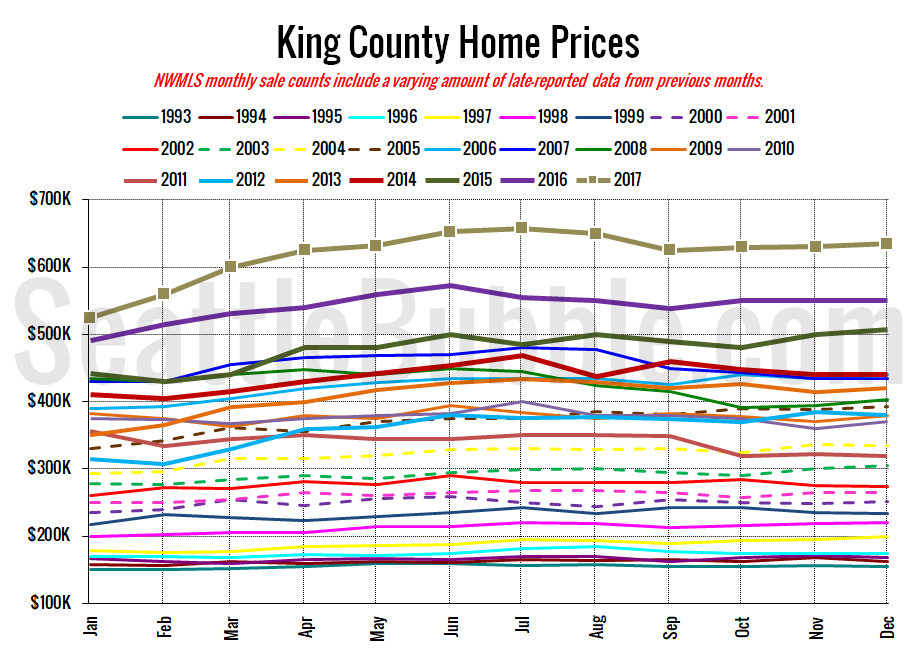
And lastly, here is the chart comparing King County SFH prices each month for every year back to 1994 (not adjusted for inflation).
Up slightly from November, but still currently $22,000 below the all-time high hit in July.
December 2017: $635,000
July 2007: $481,000 (previous cycle high)
Here’s the article from the Seattle Times: Eastside home prices surge to new record; Capitol Hill area hits $1 million median
