
Let’s check up on what’s happening with the Seattle-area housing market in early 2023, shall we?
Here’s a look at the median home sale price for King County:
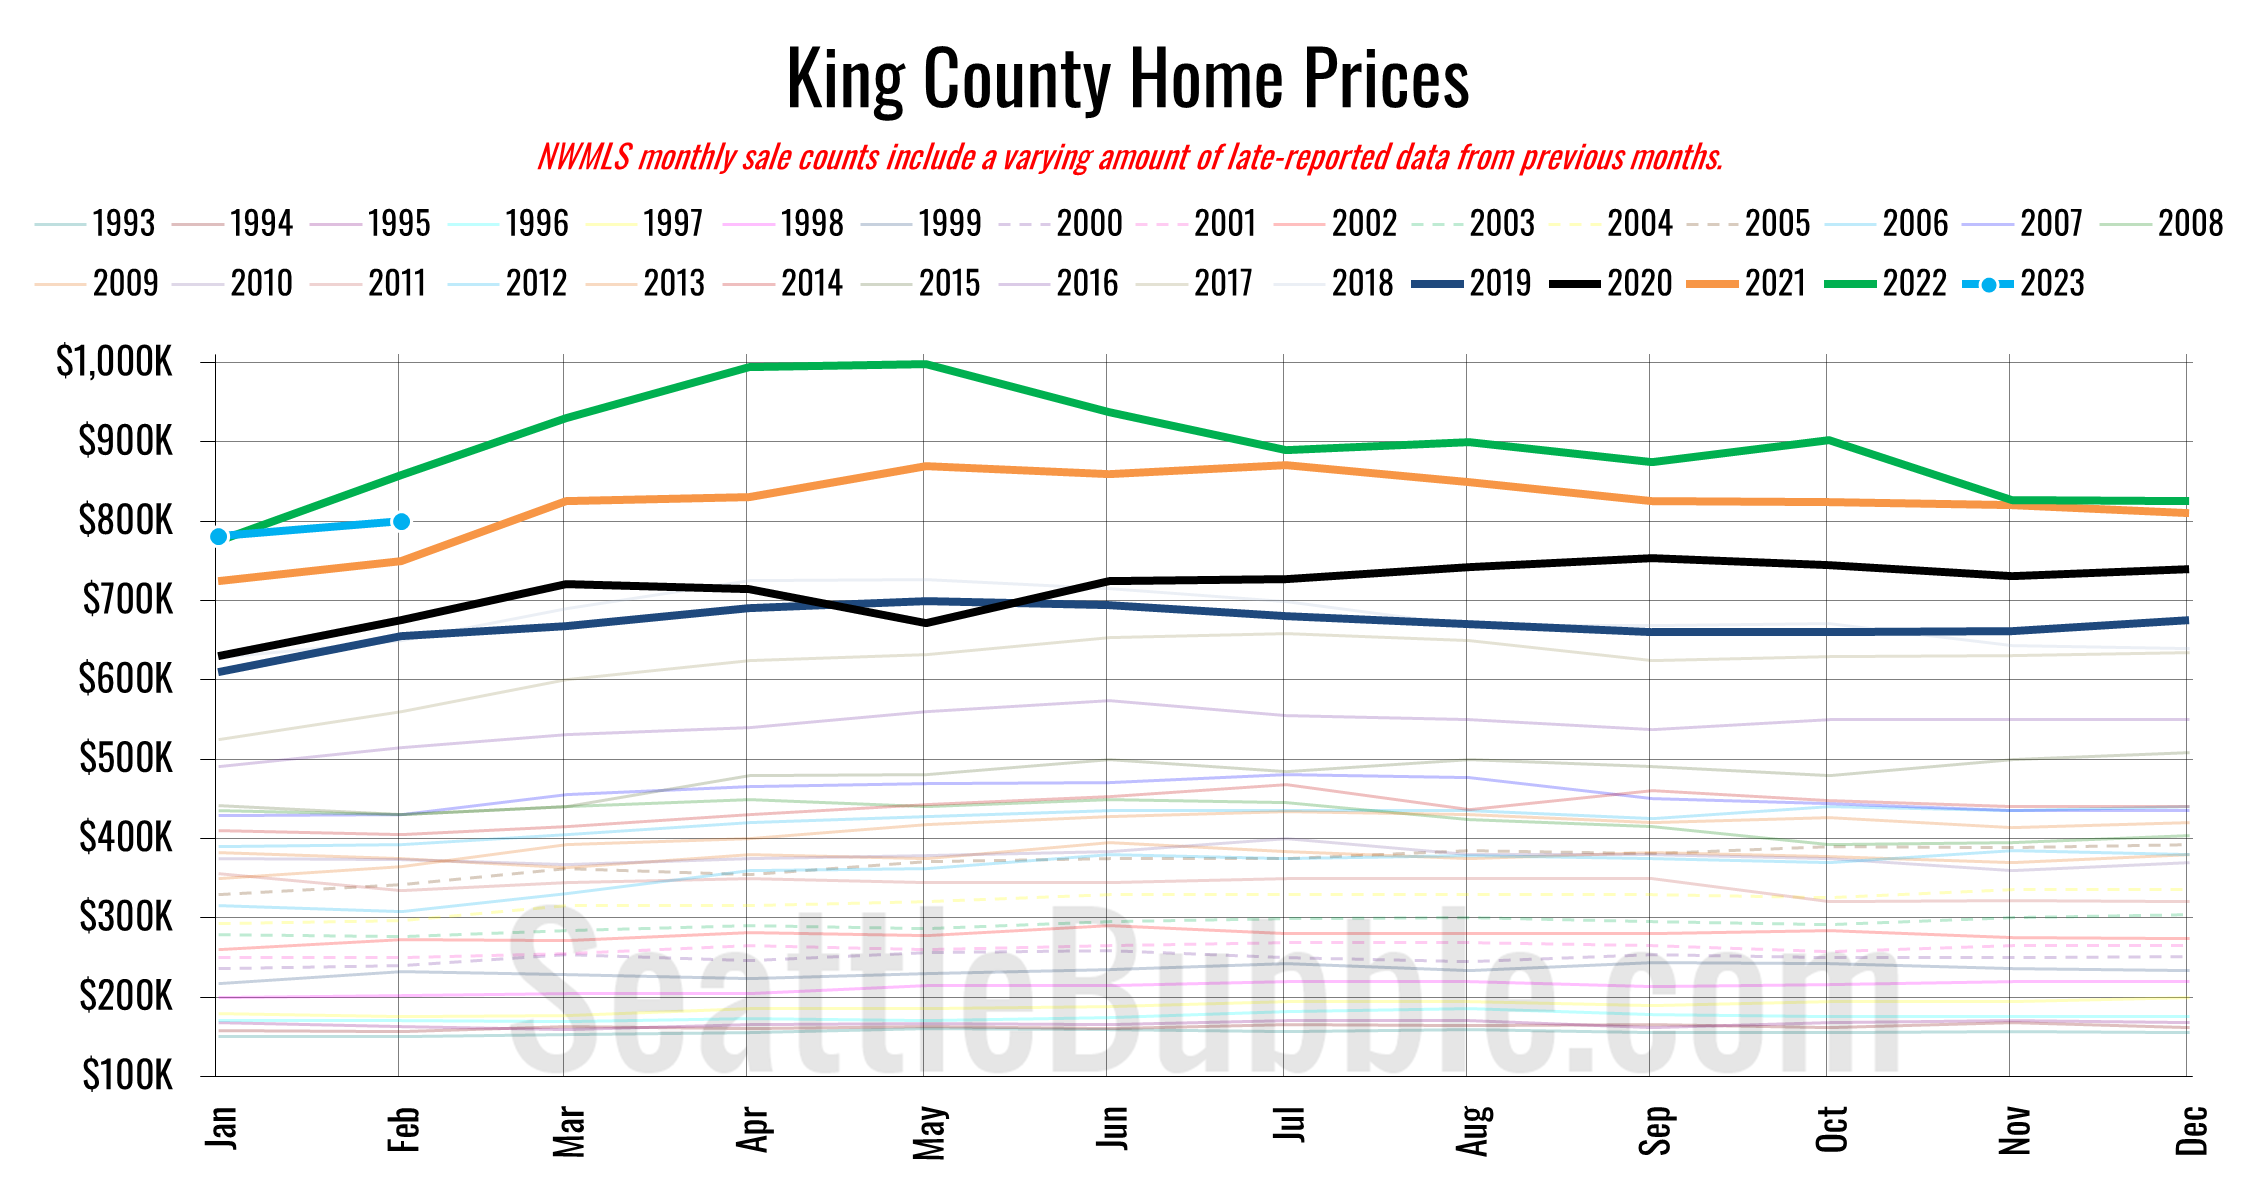
As you can see, not only are home prices down year over year (7%), but they’re also down 20% from the May peak, and with another month of flat prices, will be down from 2021 levels, as well. This is great news, of course it is entirely offset by the surge in mortgage rates that had been held artificially low for over a decade back to a more typical level over 6%.
Here’s how the Seattle area stacks up to the rest of the nation, according to the Case-Shiller Home Price Index:
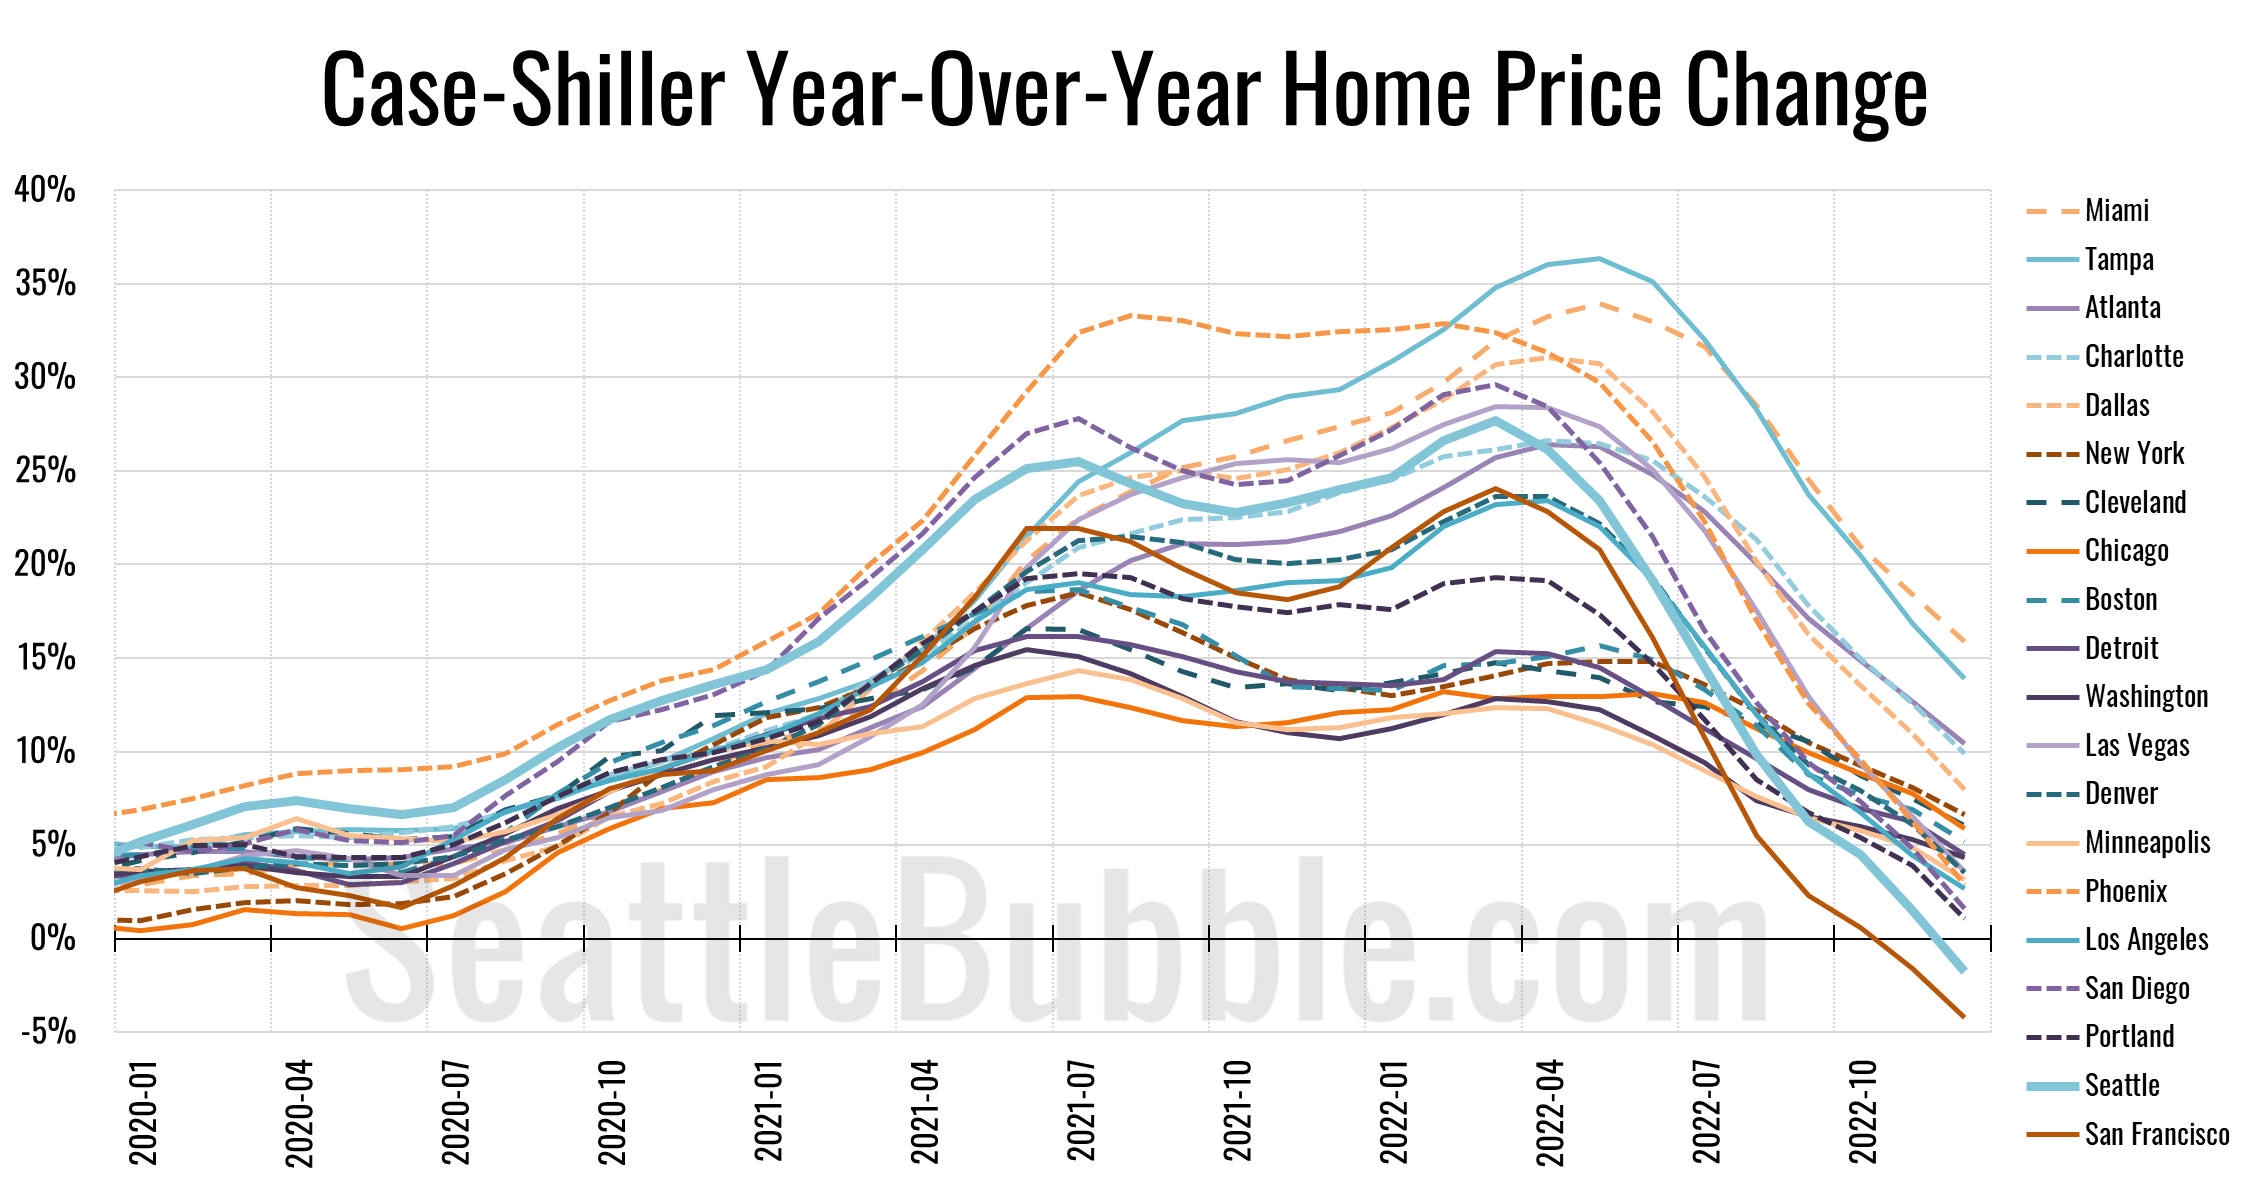
So far just Seattle and San Francisco are seeing year-over-year declines in home prices according to Case-Shiller. And the declines we’re seeing in Seattle are nothing to sneeze at, either. Have a look at the month-over-month change in Seattle’s HPI:
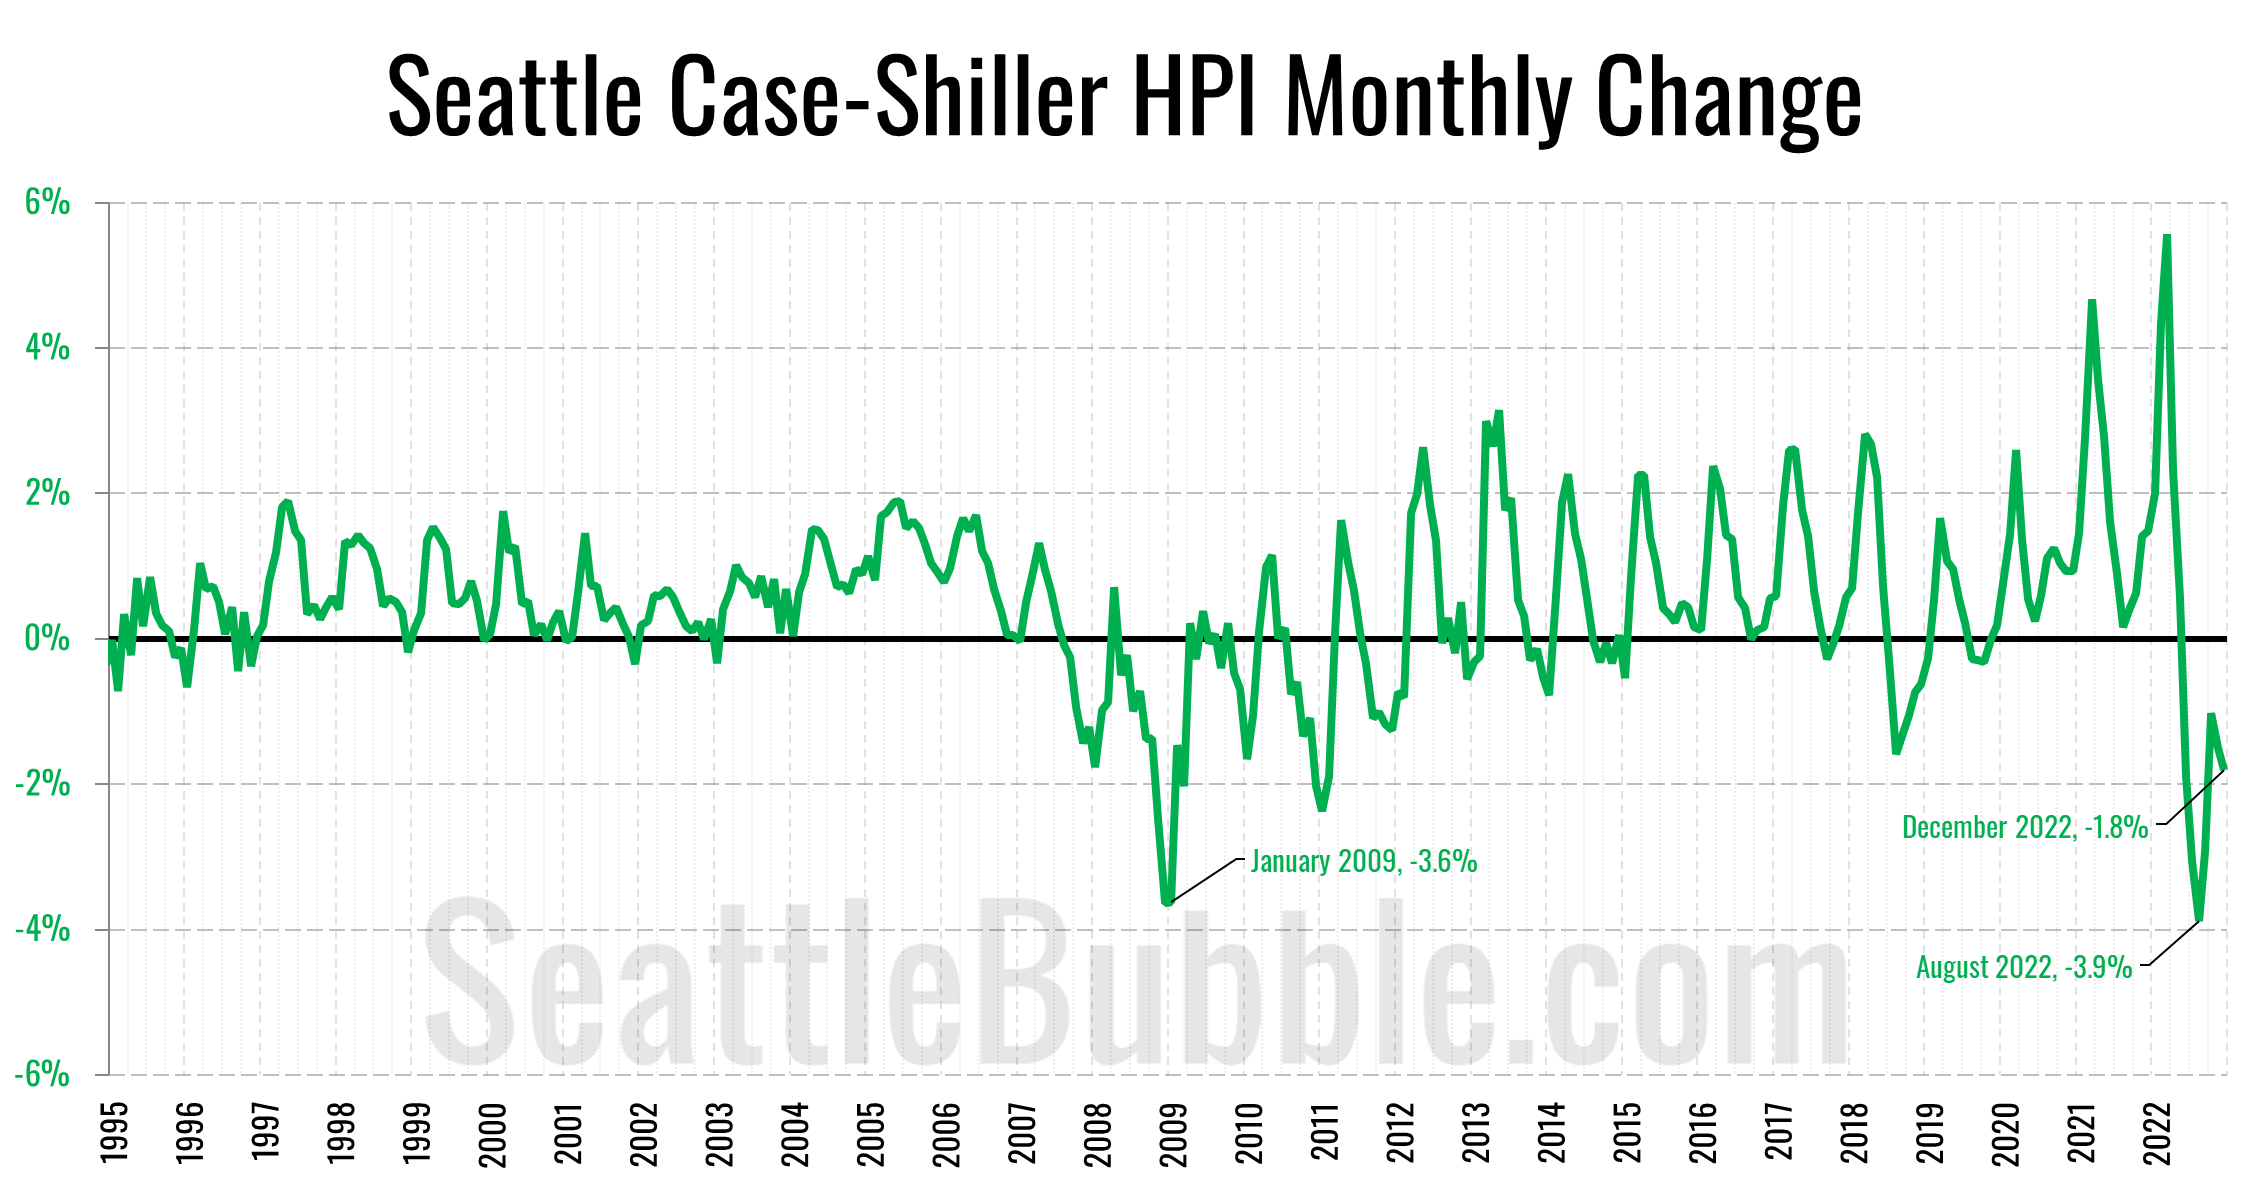
That drop from nearly a 6% monthly increase in March of last year to a 4% monthly decrease by August is the steepest turnaround we’ve ever seen. Right now the declines are larger than any time since 2011 and 2008.
Regarding those mortgage rates we mentioned earlier, here’s a chart of weekly rates and the Mortgage Banker’s Association Purchase Index, which is a good indicator of early home-buying demand:
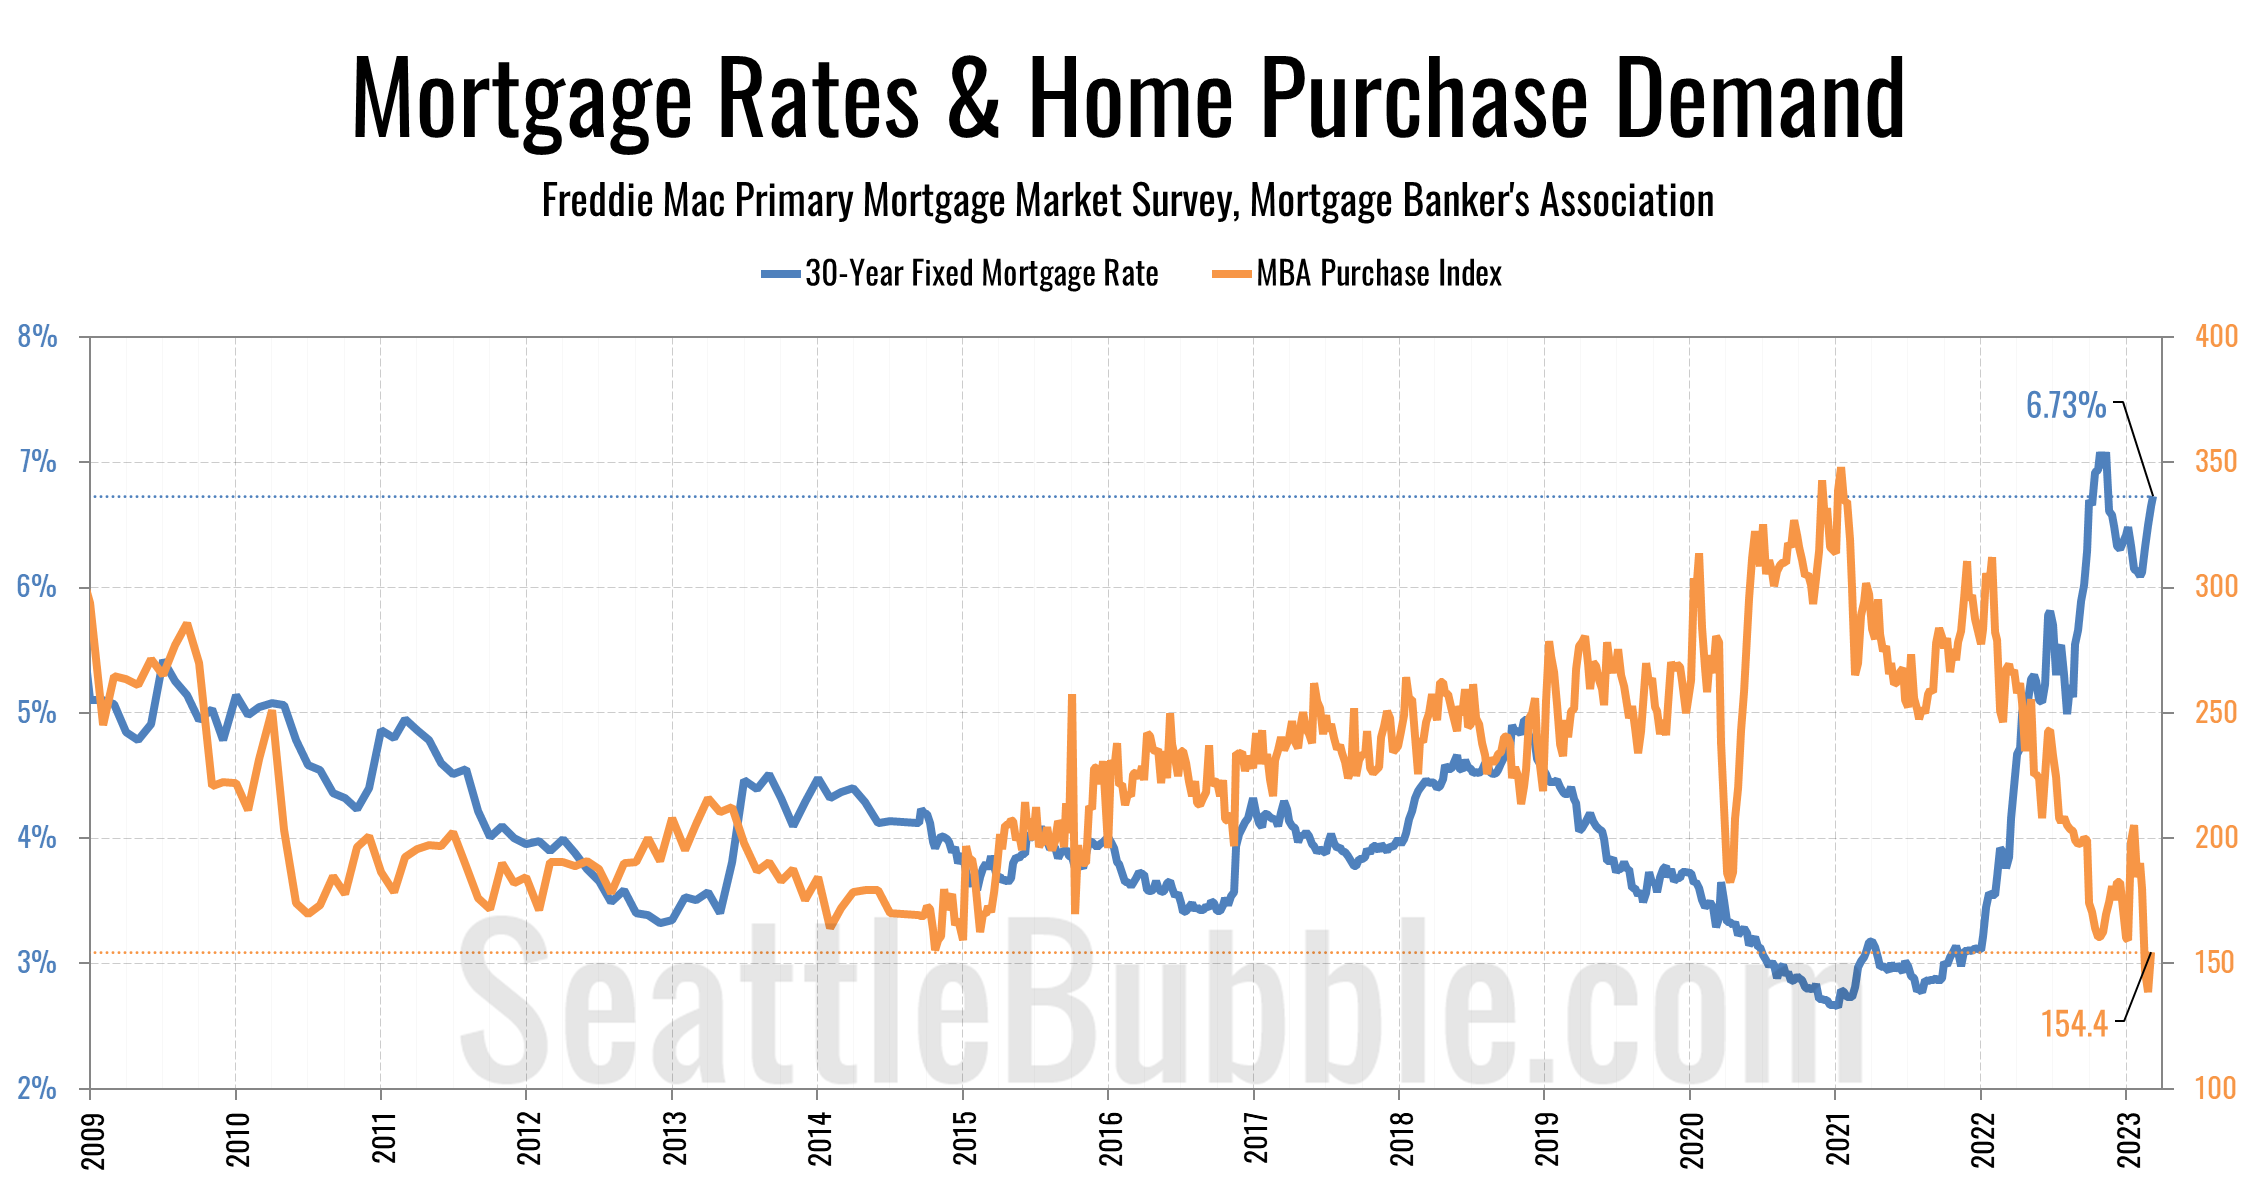
Ever since around 2019 there has been a pretty tight inverse correlation between mortgage rates and demand. When rates dropped between 2019 and 2021, demand surged. As rates have climbed through 2022 and into 2023, demand has dropped into the gutter. Personally I don’t see homebuying demand increasing much at all as long as mortgage rates stay above 6%.
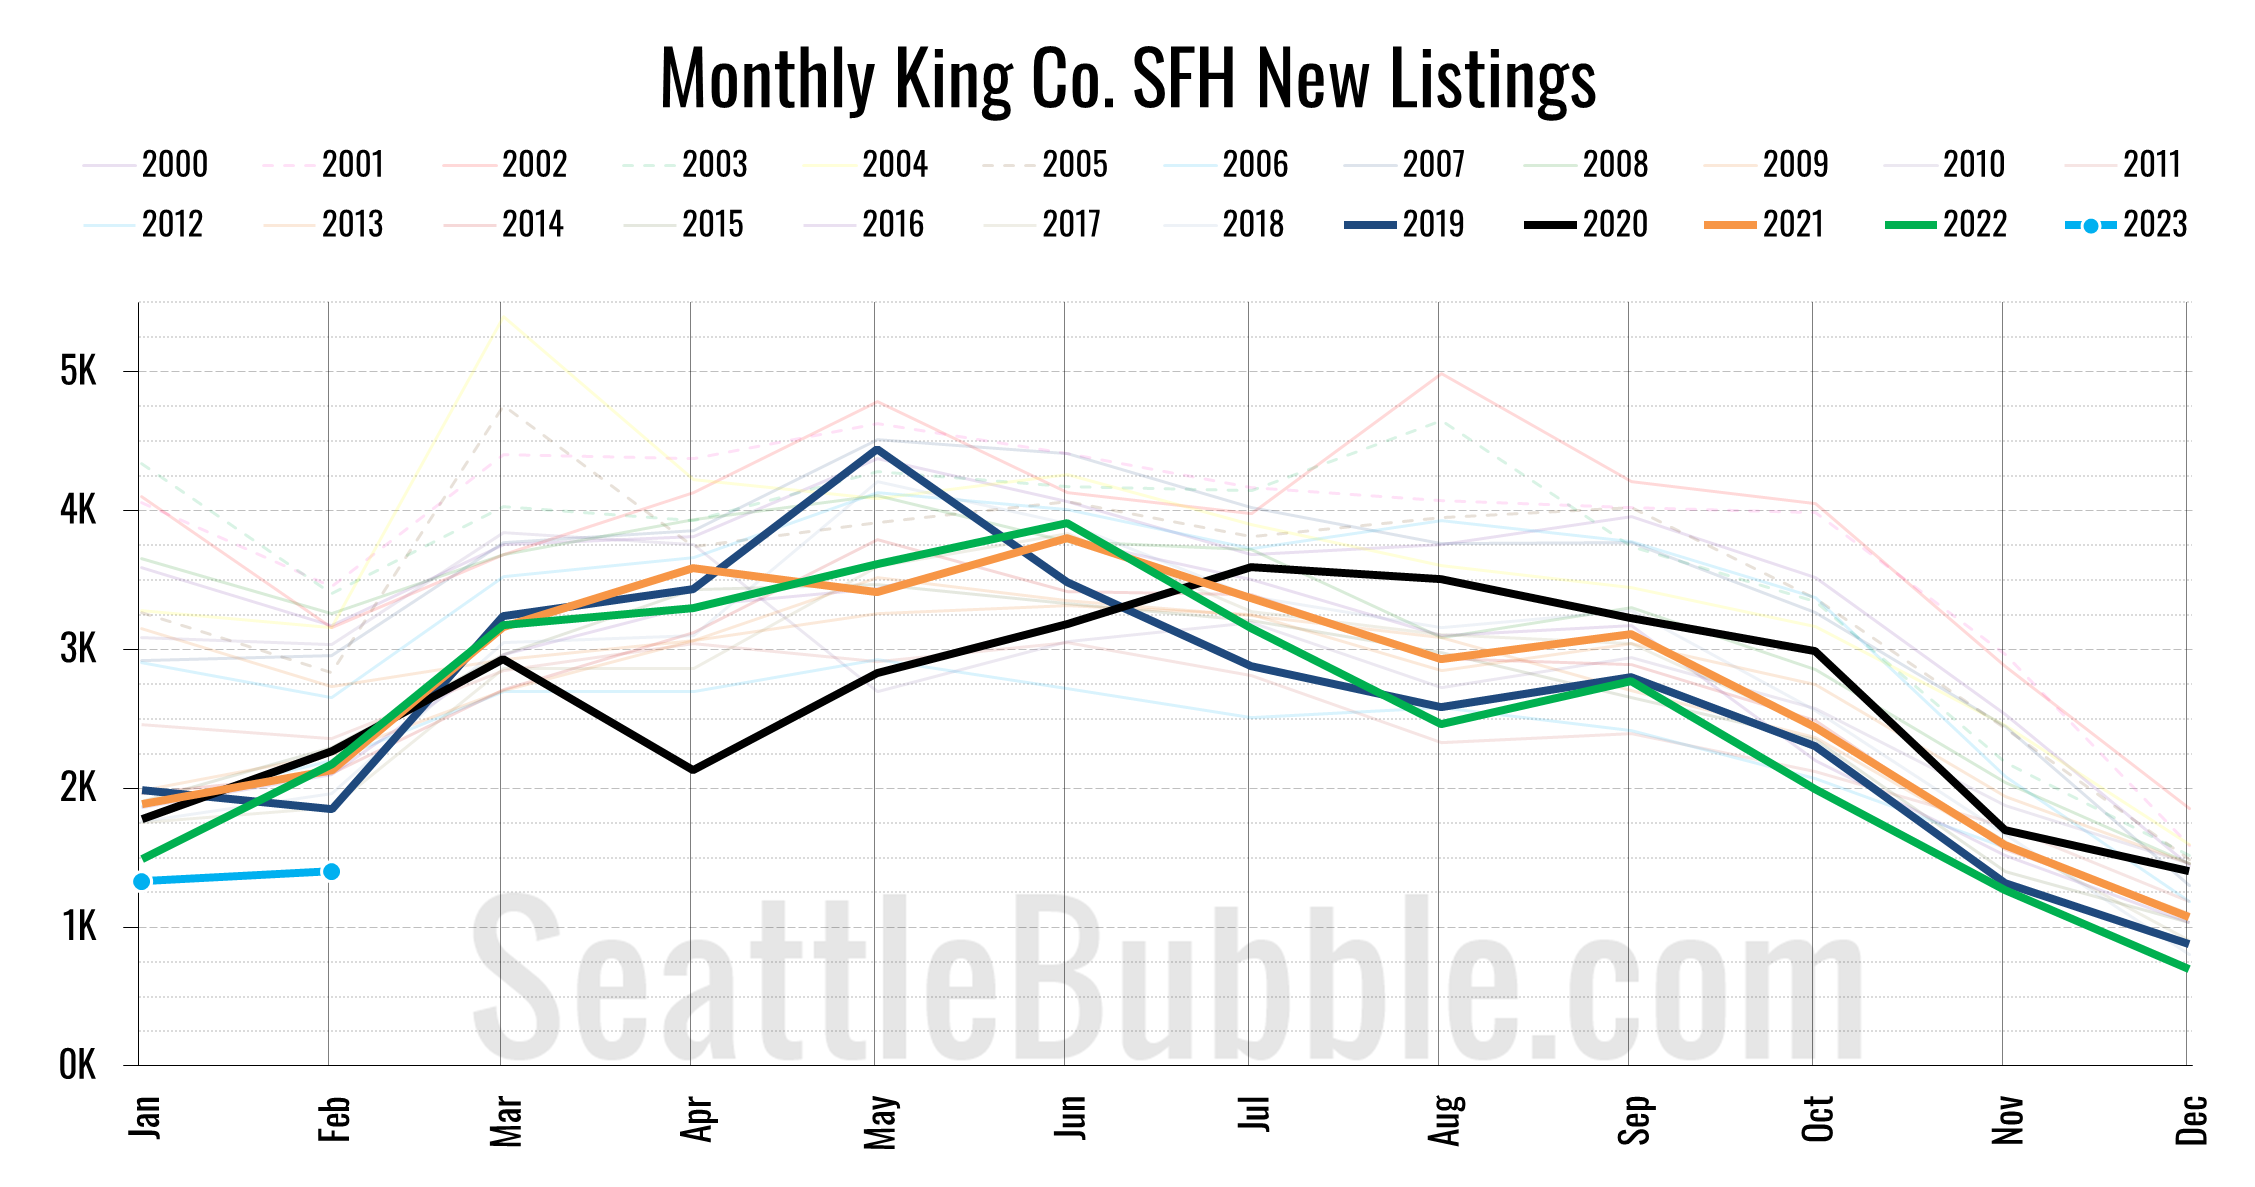
Of course, high rates are suppressing listings as well. New listings are at their lowest levels ever:
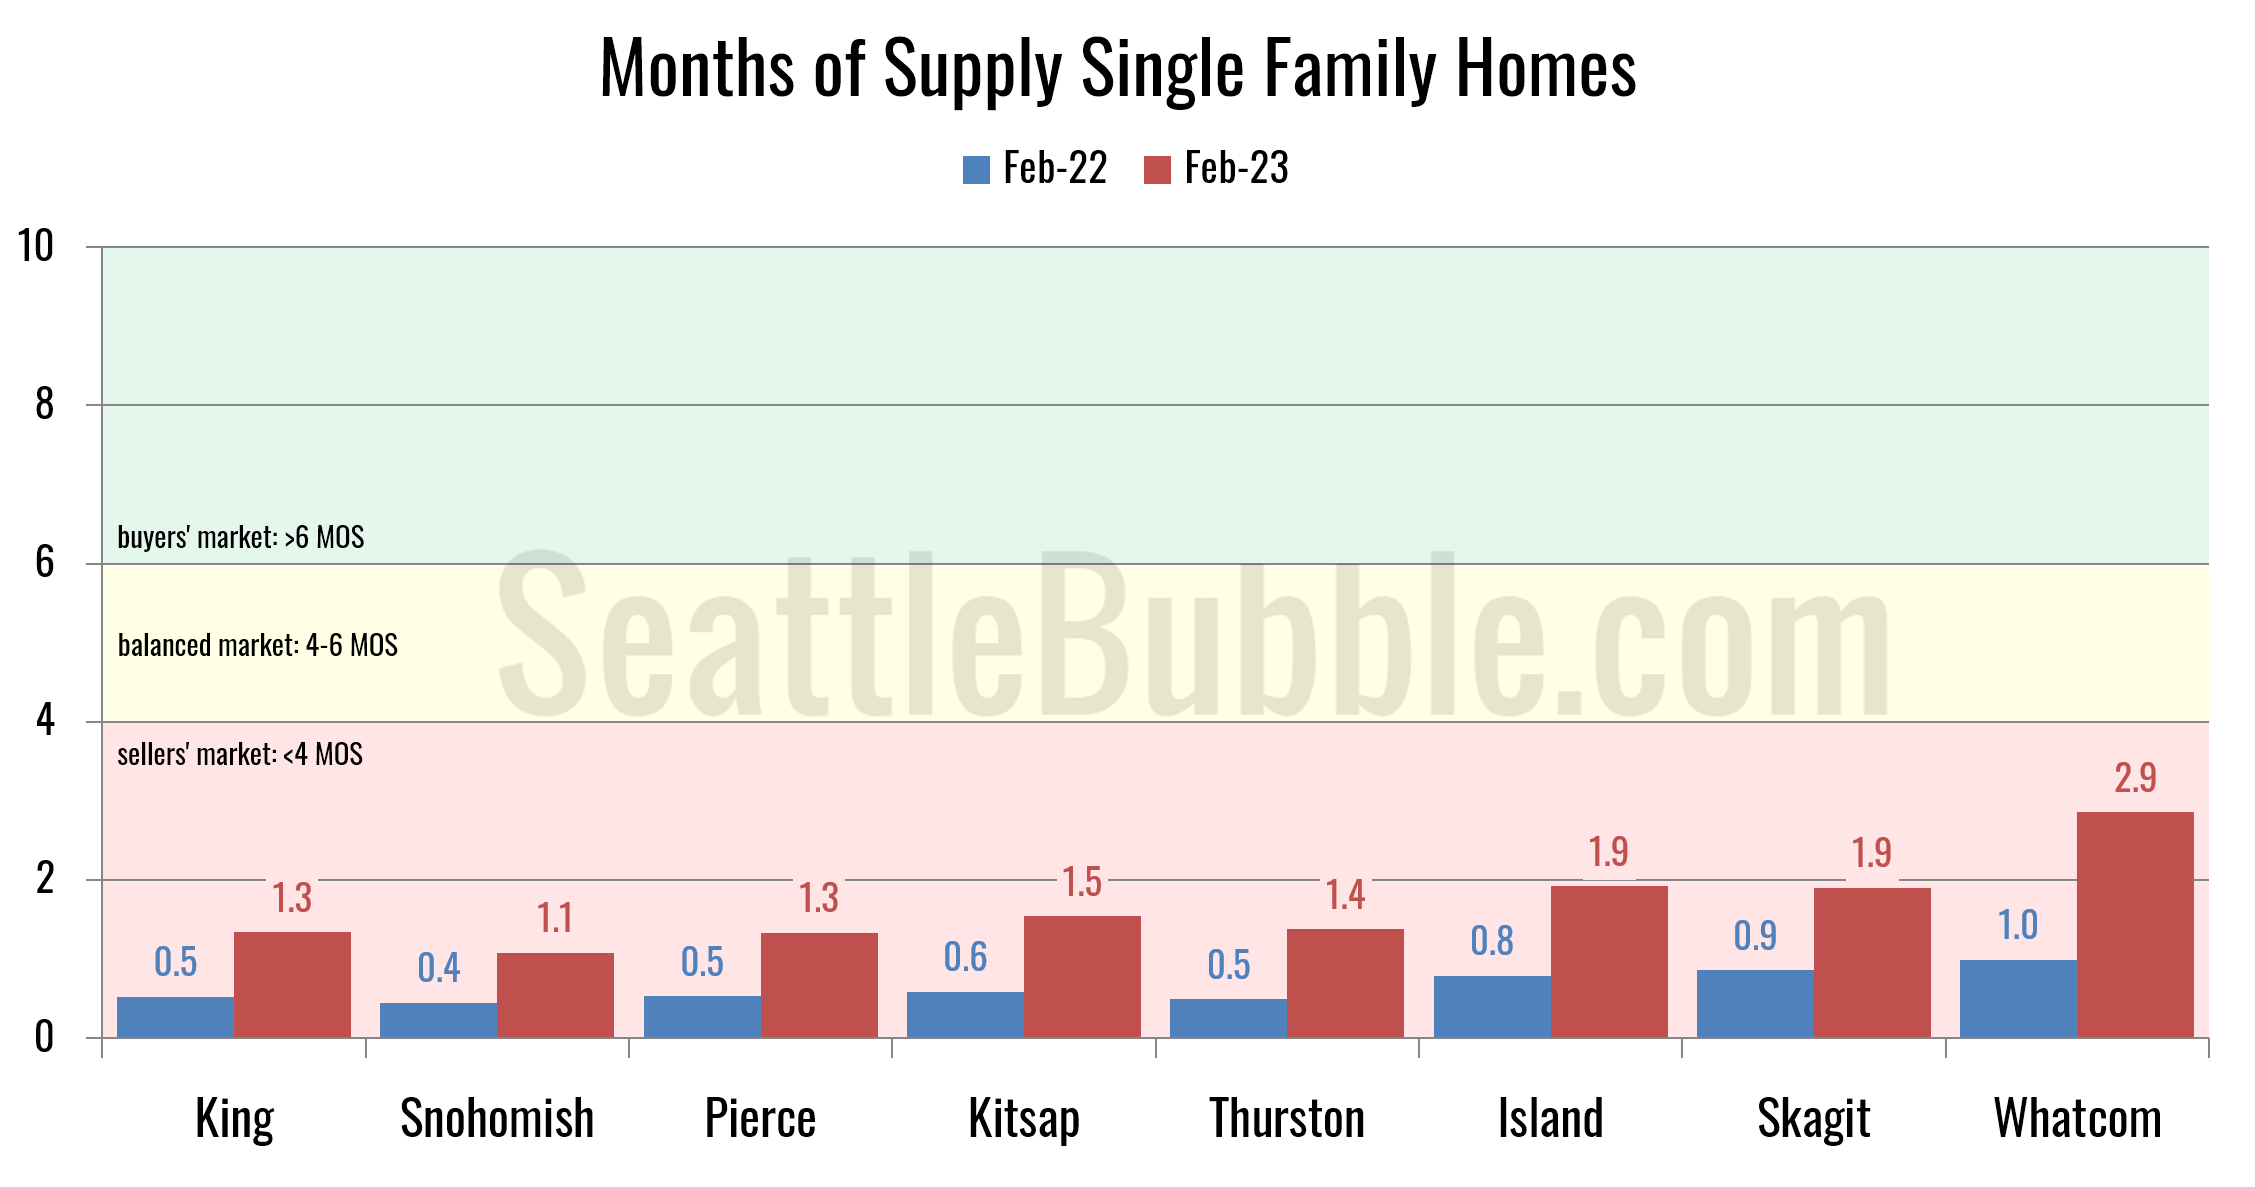
But since demand is being hit even harder, months of supply is actually creeping up all throughout the Puget Sound region:
For me the bottom line in all of this is affordability. Here’s a look at that chart:
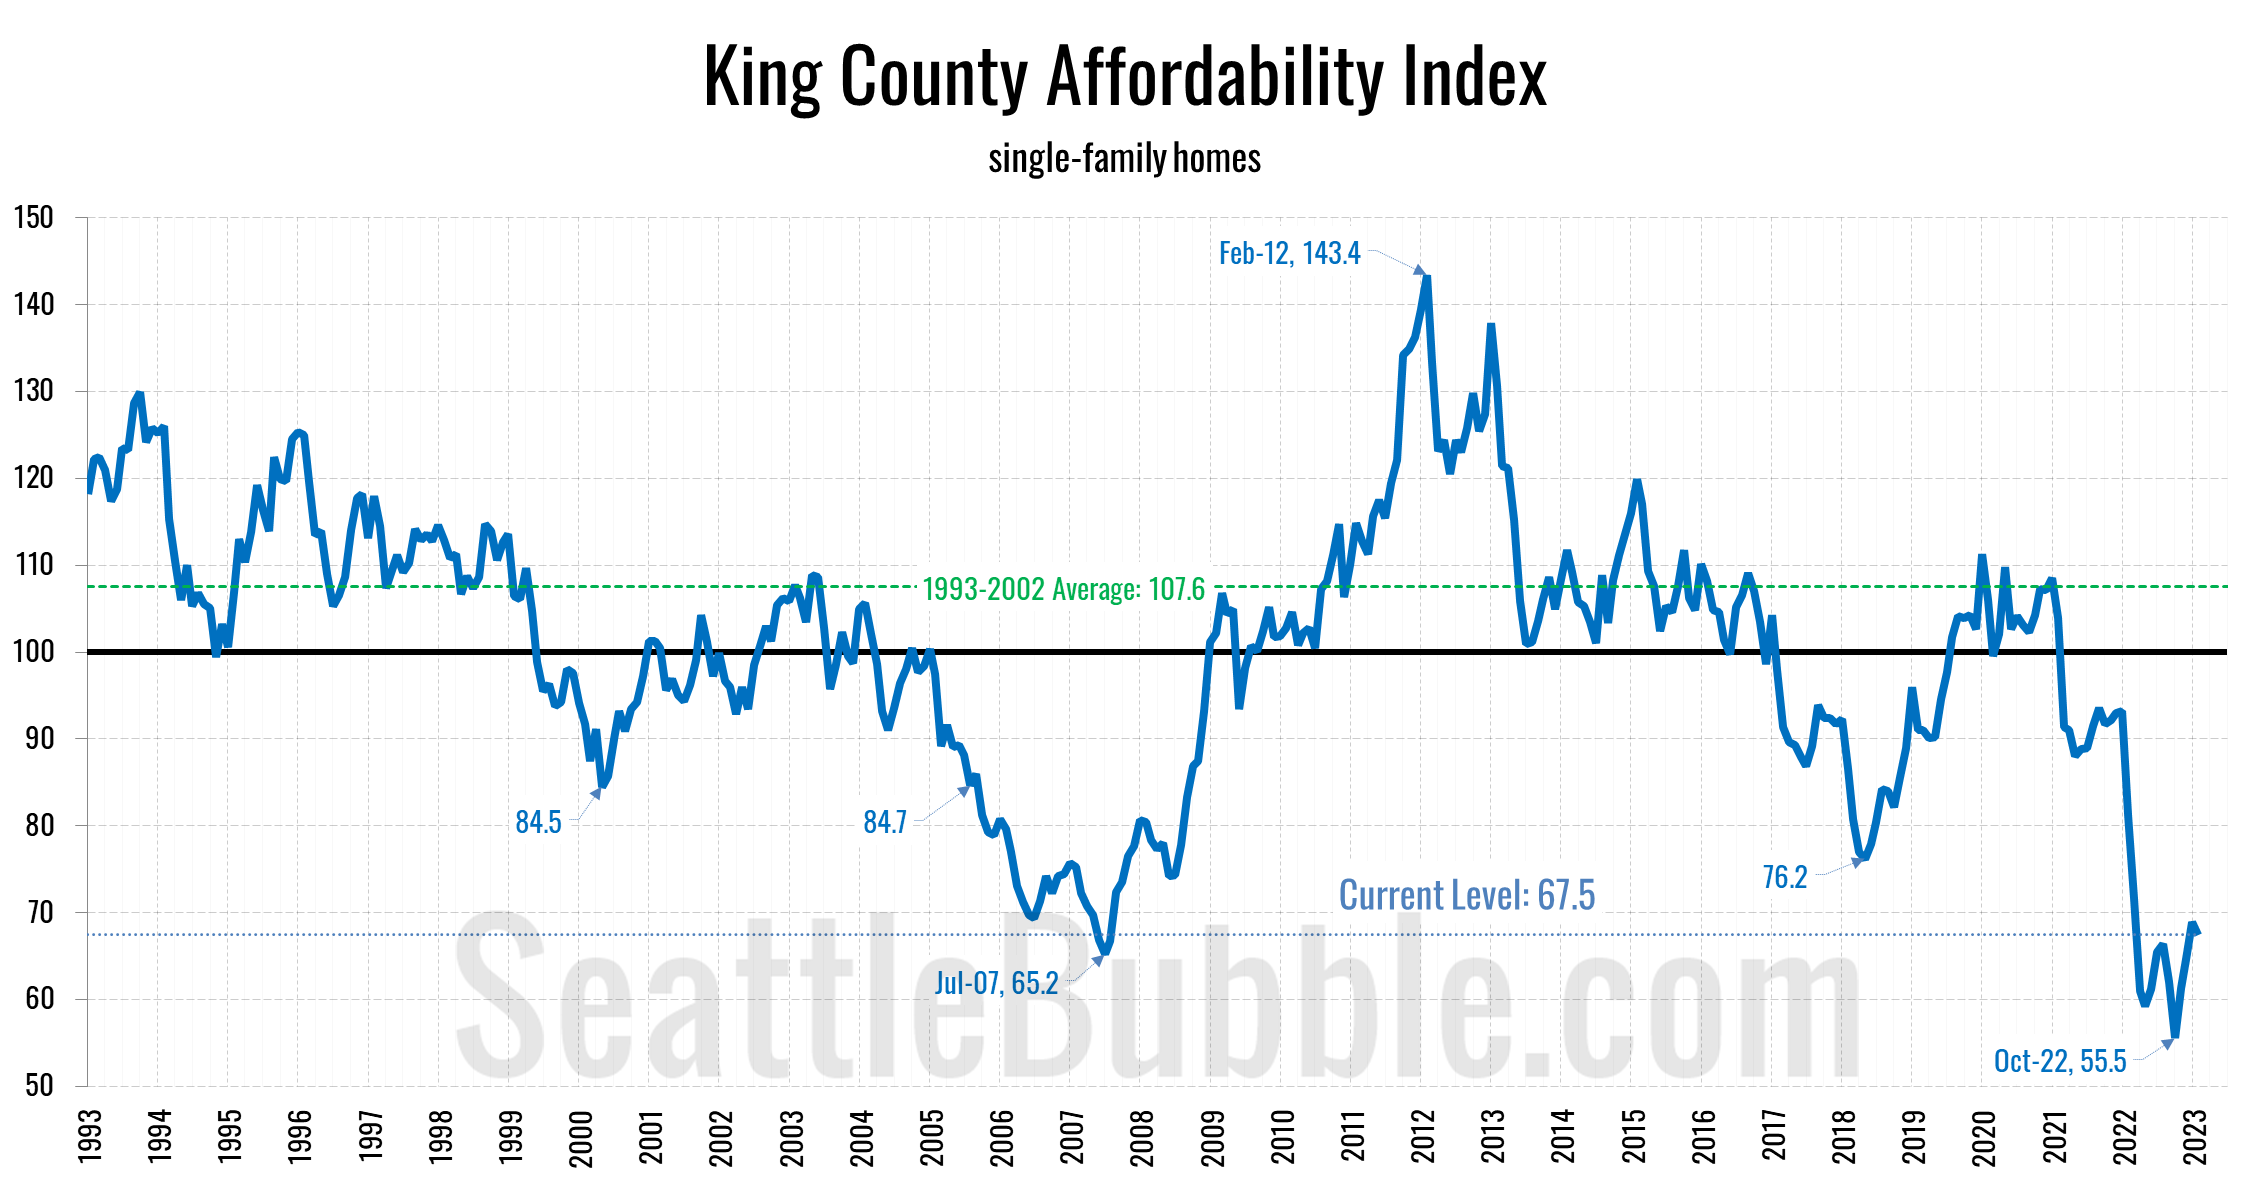
That’s rough. Even with the 20% decline in home prices since last May, surging mortgage rates have kept the affordability index close to the 2007 low. In my opinion, we still have a long way to go in this correction. I don’t know exactly how it’s going to play out, but I don’t think this kind of terrible affordability is sustainable in the long term for Seattle.
If you’re a Seattle Bubble Member, the full data for these charts and more are uploaded to the members-only data repository.
Want to join a conversation about this or other local real estate topics? We’re on Twitter (for now) at @SeattleBubble.
P.S. – For anyone following along at home, I am no longer employed by Redfin. My job was eliminated in the November layoff.