From the Seattle Times: Seattle City Council votes to impose moratorium on rent-bidding websites
The Seattle City Council voted Monday to impose a one-year moratorium on rent-bidding platforms…
local real estate news, statistics, and commentary without the sales spin.
From the Seattle Times: Seattle City Council votes to impose moratorium on rent-bidding websites
The Seattle City Council voted Monday to impose a one-year moratorium on rent-bidding platforms…
If you’re wondering about the lack of posts on these pages recently, the explanation is pretty simple: There just isn’t much to say. The Seattle-area housing market has been in a protracted boom period with ridiculously low inventory of homes for sale and rapidly-climbing prices for years now. In a lot of ways it looks like the housing bubble that was in full swing when I started this blog in 2005, but what’s going on behind the scenes is very different this time around. Is it possible that Seattle really is special this time around and the “bubble” won’t burst this time? … Maybe?
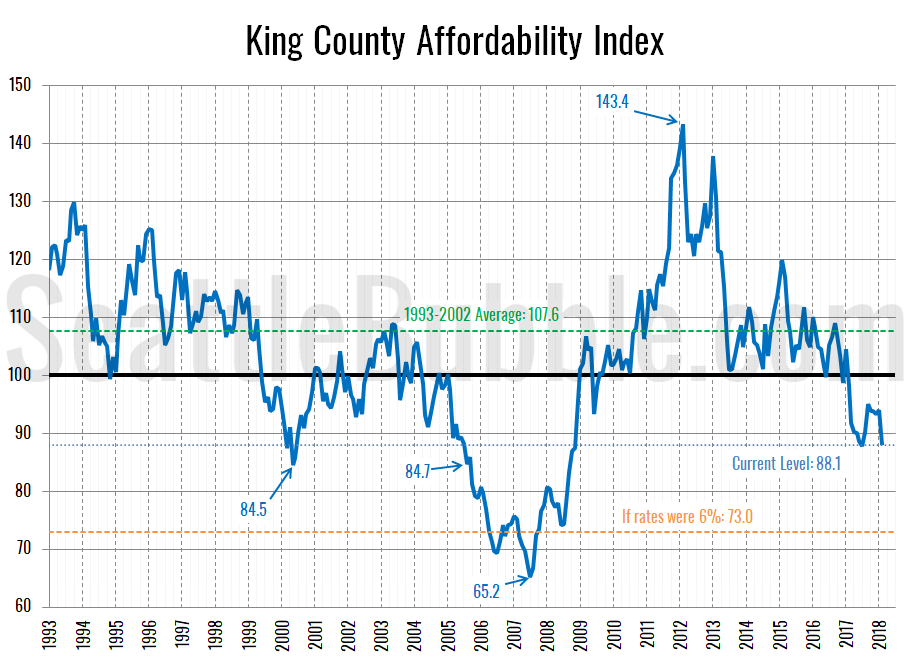
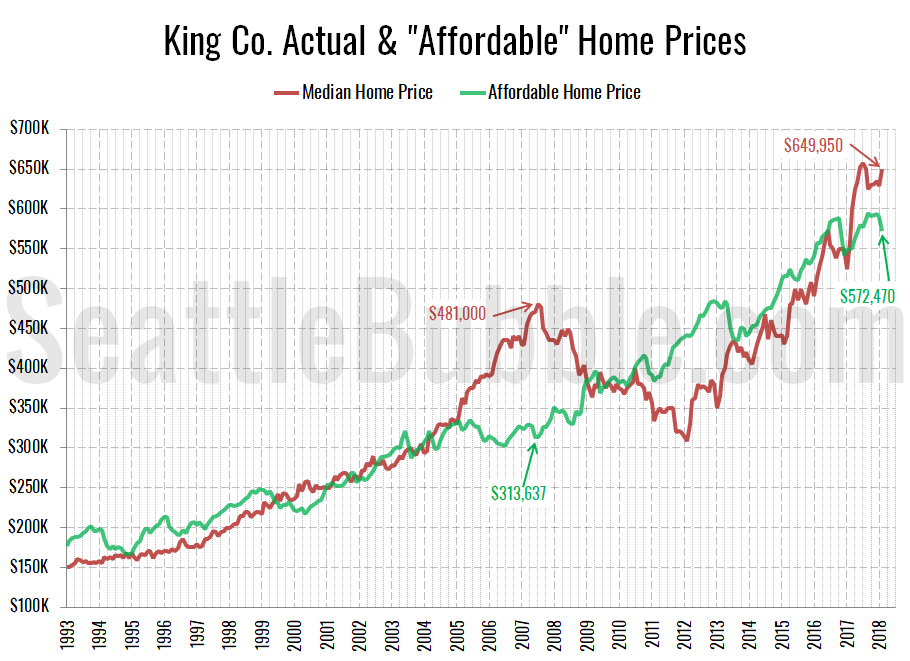
Anyway, I’ve been meaning to update more of the charts of the “fundamentals,” so let’s start with an updated look at our affordability index charts for the counties around Puget Sound.
January market stats have been published by the NWMLS. Here’s a quick excerpt from their press release:
Home Buyers Still Competing for Sparse Inventory in Western Washington, Driving Up Prices – Especially for Sought-After Condominiums
“The Seattle area real estate market hasn’t skipped a beat with pent-up demand from buyers is stronger than ever,” remarked broker John Deely in reacting to the latest statistics from Northwest Multiple Listing Service. The report on January activity shows a slight year-over-year gain in pending sales, a double-digit increase in prices, and continued shortages of inventory.
…
“The decline in sales last month can’t be blamed on the holidays, weather or football. It’s simply due to the ongoing shortage of housing that continues to plague markets throughout Western Washington,” said OB Jacobi, the president of Windermere Real Estate.
Bummer for home salespeople that they can’t use the “football” excuse they usually throw out in January. Not that there’s really anything in these latest numbers for them to be concerned about.
Now let’s dive into the numbers for January…
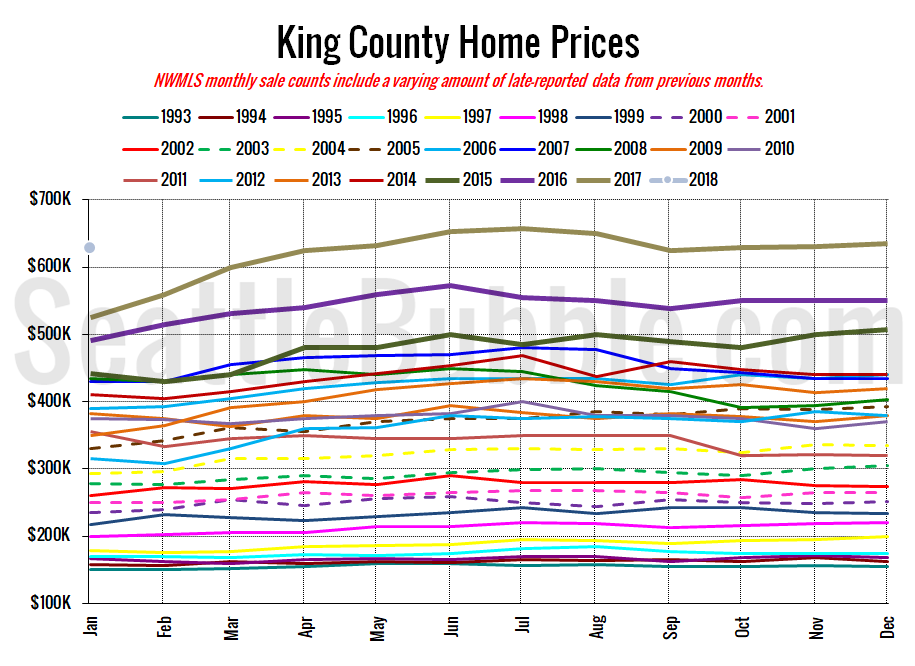
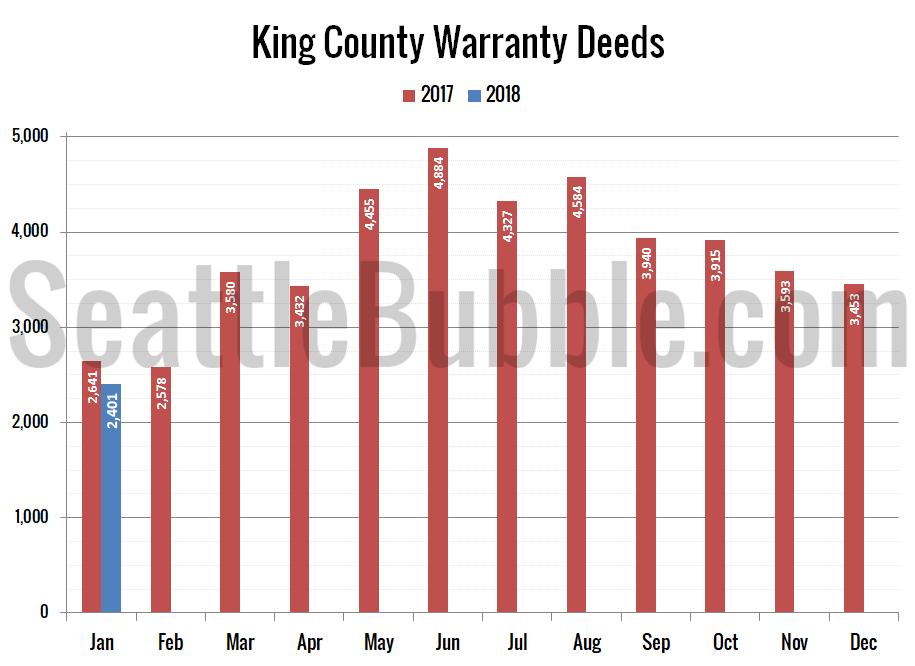
Inventory is at its lowest January level ever, and new listings were only barely above last year’s record-low level. Despite having nearly the same number of new listings as last year, closed sales and pending sales are both down considerably. Meanwhile, prices are up nearly twenty percent year-over-year.
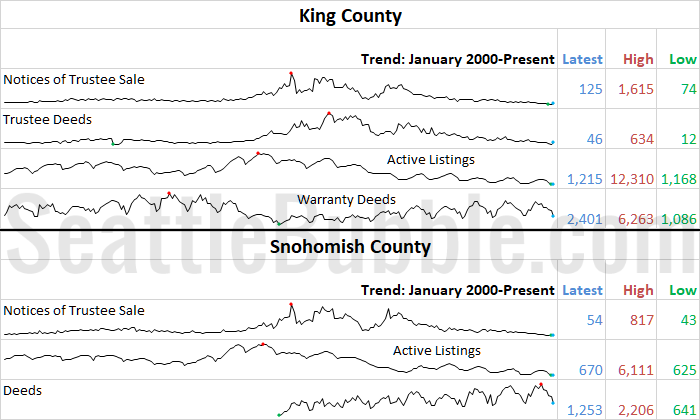
Here’s the summary for January: Yet another new all-time low point for inventory in both counties. Sales were lower than a year earlier, but not dramatically. Foreclosures are still basically zero.
Here’s the snapshot of all the data as far back as my historical information goes, with the latest, high, and low values highlighted for each series:

So far there are no glimmers of hope for buyers as 2018 kicks off.
After the final 2017 Seattle-area real estate sales data was released last week by the NWMLS, I updated my chart of the “Residential Real Estate Heat Index” for King County single-family homes and condos.
As a reminder, the “Residential Real Estate Heat Index” is an index that rolls changes in the median price, new listings, total inventory, pending sales and closed sales all into a single number to measure the relative “heat” of the market. Note that this index only looks at the real estate sales market. It does not factor in any other economic conditions such as wages, interest rates, rents, etc.
Below is the latest data for the heat index of King County single-family homes and condos…