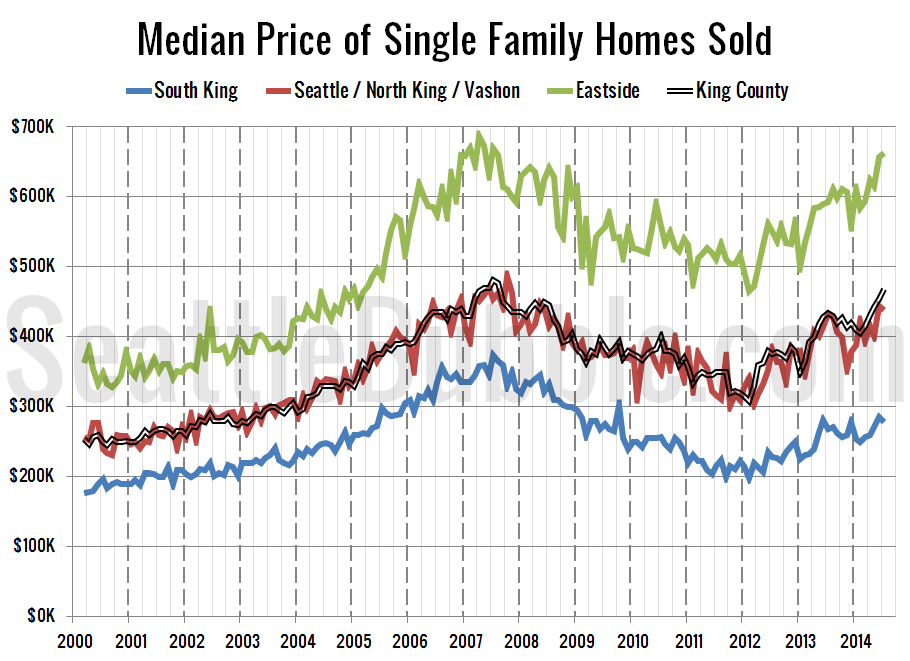
It’s time once again to take an updated look at how King County’s sales are shifting between the different regions around the county, since geographic shifts can and do affect the median price. In order to explore this concept, we break King County down into three regions, based on the NWMLS-defined “areas”: low end: South…
Author: The Tim
Weekly Open Thread (2014-08-18)
NOTE: If you are subscribed to Seattle Bubble’s RSS feed and are seeing these open threads in the feed, please switch to our official feed at http://feeds.feedburner.com/SeattleBubble Thanks! Here is your open thread for the week of August 18th, 2014. You may post random links and off-topic discussions here. Also, if you have an idea…
Poll: Are We In Another Housing Bubble?
This poll was active 08.17.2014 through 08.23.2014
Another Bubble? Affordability Only Sustained By Low Rates
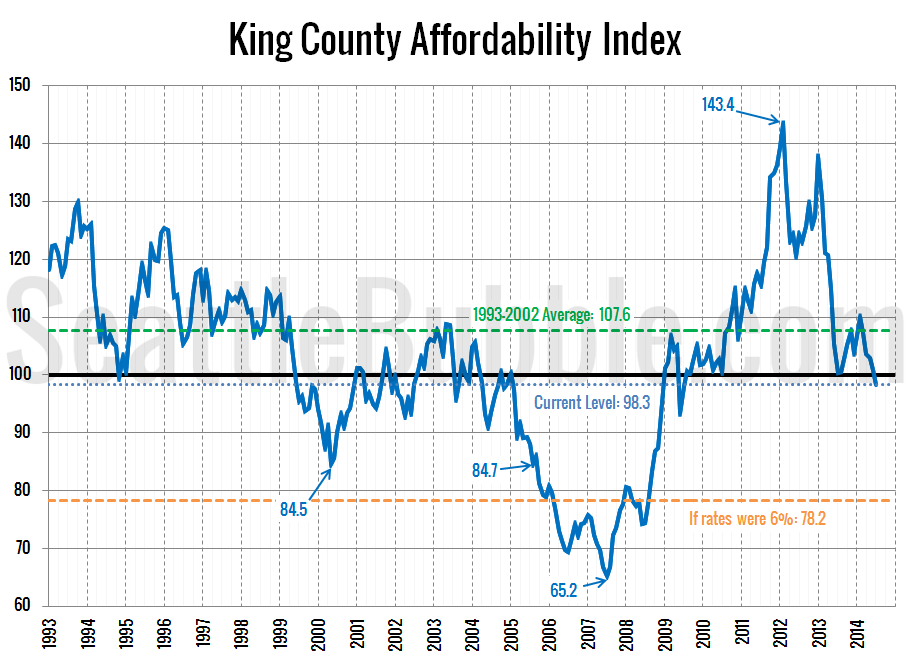
Continuing our “Another Bubble?” series, it’s time to take a look at the affordability index. As King County’s median home price has surged from $405,400 in February to $468,000 in July, the affordability index has dropped from slightly above the long-term average to just below 100. An index level above 100 indicates that the monthly…
Another Bubble? Home Prices Rapidly Outgain Incomes
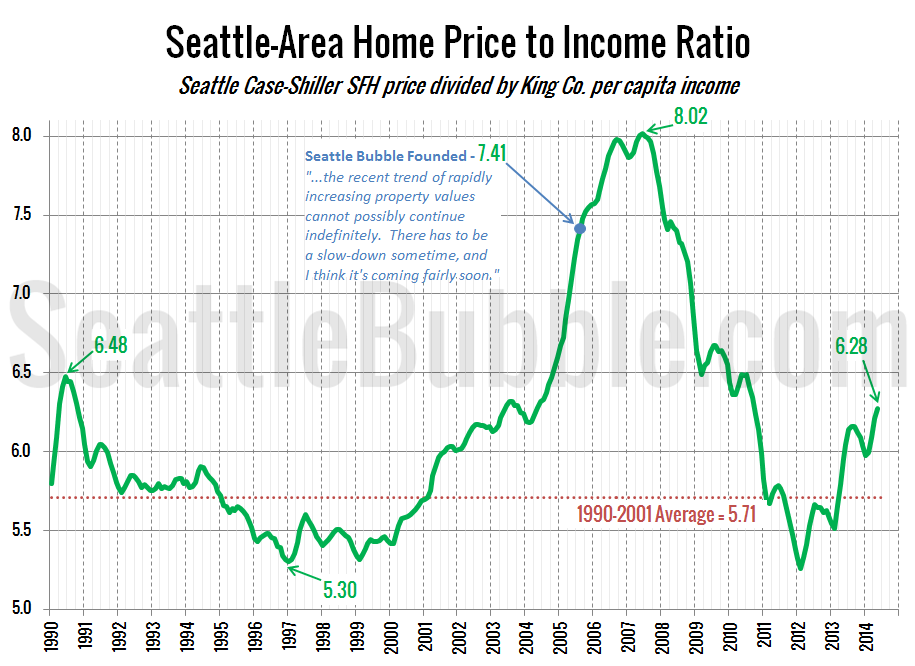
Continuing the “Another Bubble?” series we began yesterday, let’s take a look at another housing bubble metric: home prices compared to incomes. For this post I’ll be using the Case-Shiller Home Price Index for the Seattle area (which rolls together King, Snohomish, and Pierce counties) and Bureau of Economic Analysis data on per capita incomes…


