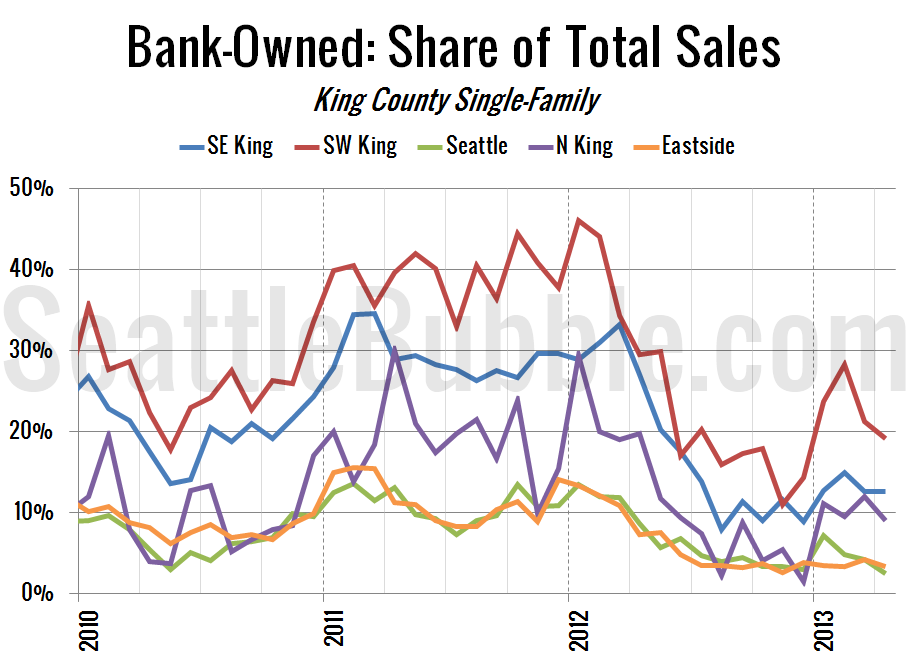
Here’s one more chart on the share of sales that were bank-owned homes. This one shows the share of sales that were bank-owned broken down by the NWMLS-defined regions. In this chart I’ve grouped zip codes into their approximate NWMLS regions, which break South County into SE King and SW King and display Seattle and…
Category: Neighborhoods
South King and Eastside Sales Neck and Neck
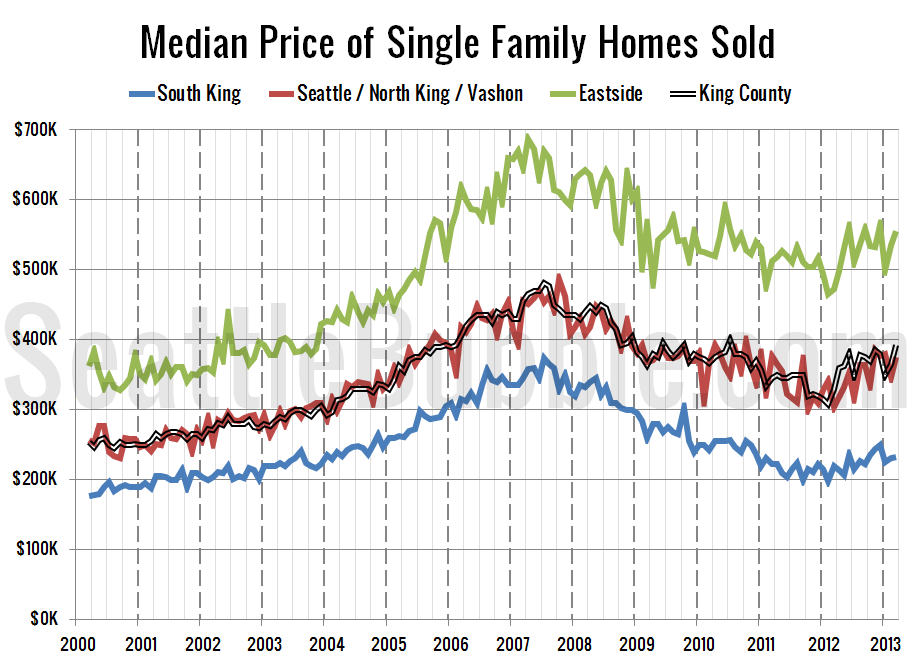
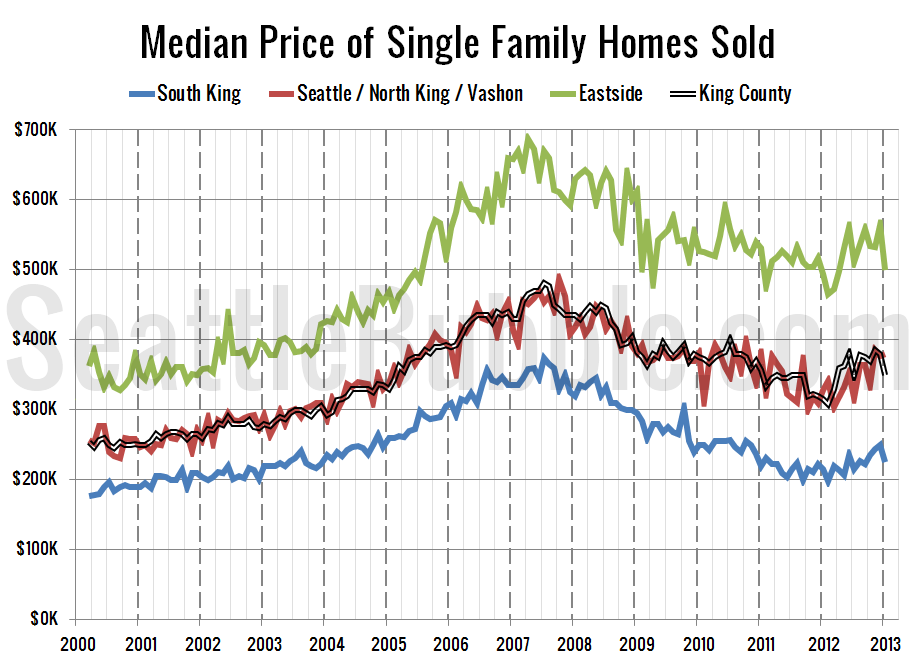
Let’s take an updated look at how King County’s sales are shifting between the different regions around the county, since geographic shifts can and do affect the median price. In order to explore this concept, we break King County down into three regions, based on the NWMLS-defined “areas”: low end: South County (areas 100-130 &…
Southwest King County Still Most-Distressed
I haven’t posted this in a few months, but here’s a chart that I keep of the share of sales in each NWMLS region that were bank-owned. In this chart I’ve grouped zip codes into their approximate NWMLS regions, which break South County into SE King and SW King and display Seattle and N King…
Expensive Eastside Home Sales Spiked in February
Let’s take an updated look at how King County’s sales are shifting between the different regions around the county, since geographic shifts can and do affect the median price. In order to explore this concept, we break King County down into three regions, based on the NWMLS-defined “areas”: low end: South County (areas 100-130 &…
Low End Sales Spike, High End Slips
Let’s take an updated look at how King County’s sales are shifting between the different regions around the county, since geographic shifts can and do affect the median price. In order to explore this concept, we break King County down into three regions, based on the NWMLS-defined “areas”: low end: South County (areas 100-130 &…


