Skip to content

Seattle Bubble

local real estate news, statistics, and commentary without the sales spin.

Menu
  • Home
  • About
  • Contact
  • Reference
  • Speaking
Menu

Category: Counties

County-wide statistics.

August Stats Preview: Sales Slip But Market Still Strongly Favors Sellers

Posted on September 2, 2015September 4, 2015 by The Tim

Get access to the full spreadsheets used to make the charts in this post by becoming a member of Seattle Bubble.

With August now behind us, let’s have a look at our monthly stats preview. First up, here’s the snapshot of all the data as far back as my historical information goes, with the latest, high, and low values highlighted for each series…
Share:

  • Twitter
  • LinkedIn
  • Facebook
  • Reddit
  • Pinterest
  • Email

Case-Shiller Tiers: More Across the Board Increases in June

Posted on August 27, 2015September 22, 2015 by The Tim

Get access to the full spreadsheets used to make the charts in this post by becoming a member of Seattle Bubble.

Let’s check out the three price tiers for the Seattle area, as measured by Case-Shiller. Remember, Case-Shiller’s “Seattle” data is based on single-family home repeat sales in King, Pierce, and Snohomish counties.

Note that the tiers are determined by sale volume. In other words, 1/3 of all sales fall into each tier…

Share:

  • Twitter
  • LinkedIn
  • Facebook
  • Reddit
  • Pinterest
  • Email

Case-Shiller: Year-Over-Year Gains Stabilizing in June

Posted on August 26, 2015September 4, 2015 by The Tim

Please consider supporting Seattle Bubble by becoming a member. Thanks!

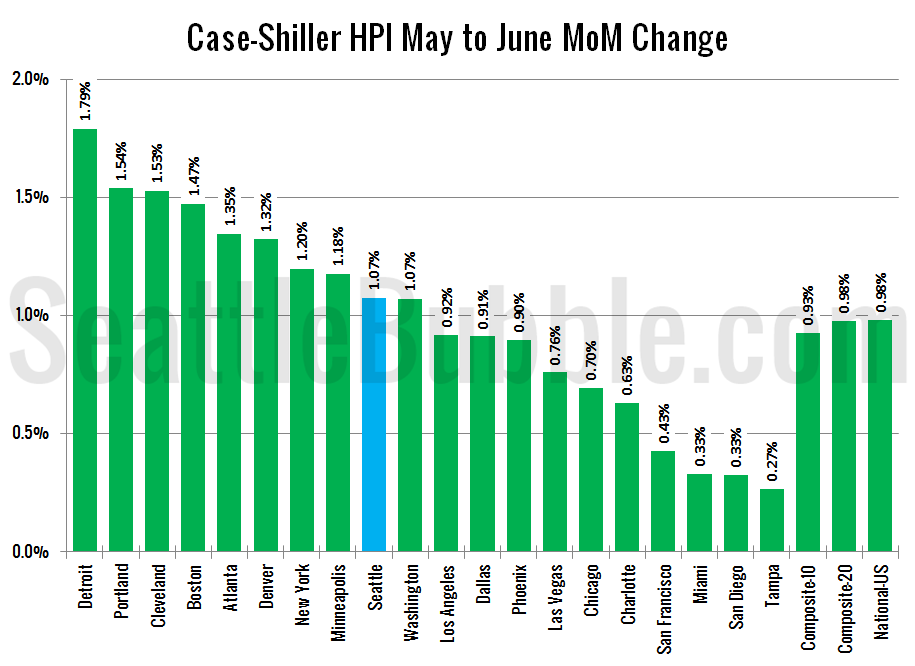
Let’s have a look at the latest data from the Case-Shiller Home Price Index. According to April data, Seattle-area home prices were:

Up 1.1% May to June
Up 7.4% YOY…

Share:

  • Twitter
  • LinkedIn
  • Facebook
  • Reddit
  • Pinterest
  • Email

Will 2015 Be the Bottom for Listings?

Posted on August 18, 2015August 24, 2015 by The Tim

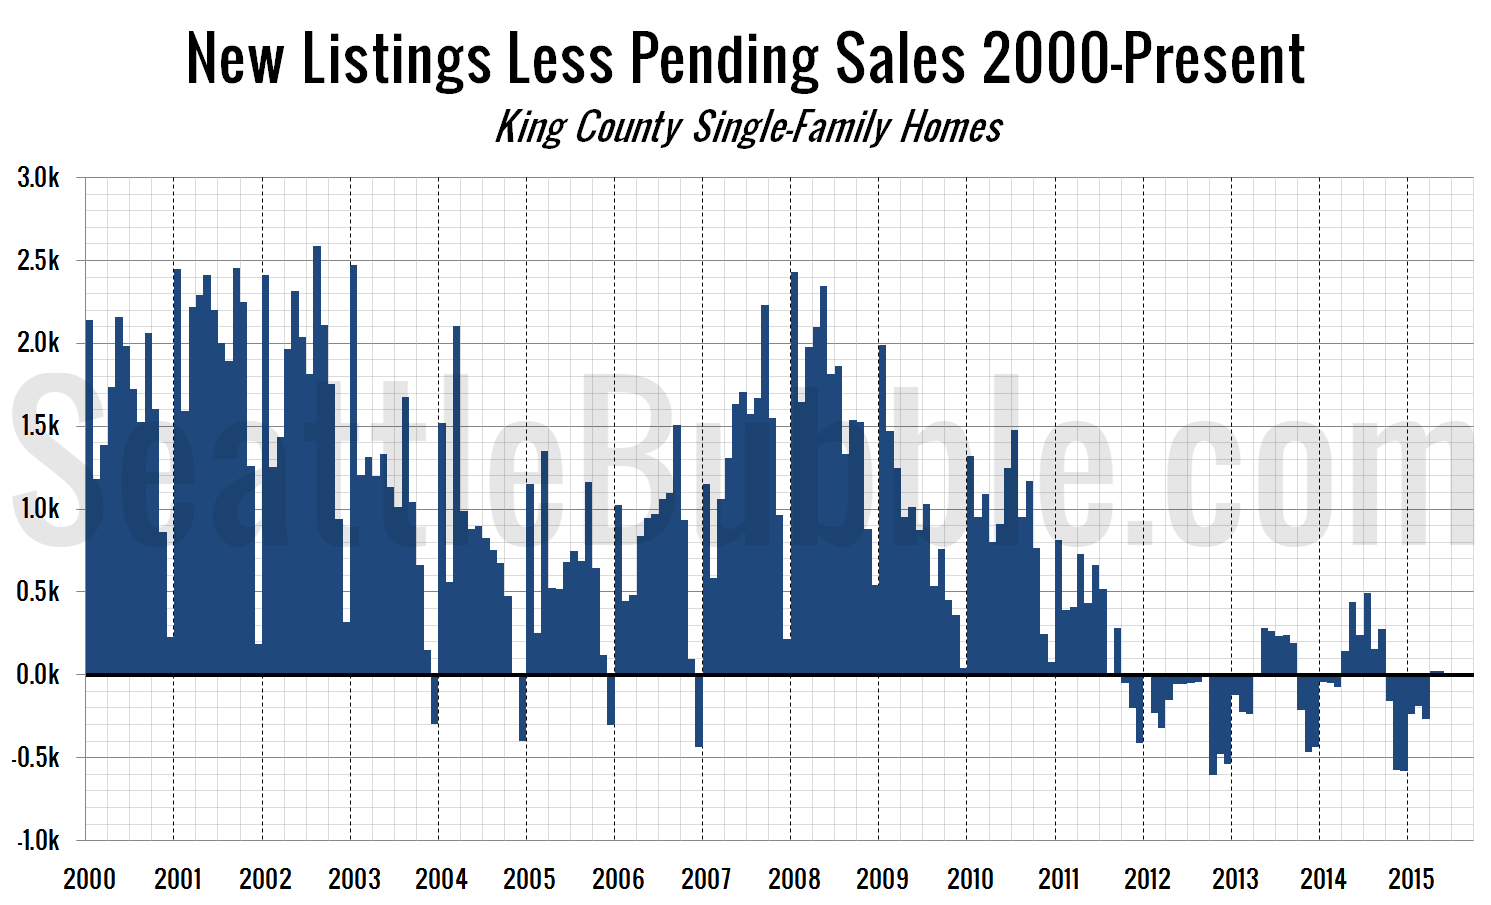
Let’s see how listings have been doing in the last couple months. First up, here’s a look at new listings for just the last month, compared to July of every other year, and the same chart but for the last three months combined: New listings had been recovering somewhat in 2013 and 2014, but this…

Share:

  • Twitter
  • LinkedIn
  • Facebook
  • Reddit
  • Pinterest
  • Email

Home Price to Rent Ratio Still Below Bubble Territory

Posted on August 13, 2015August 18, 2015 by The Tim

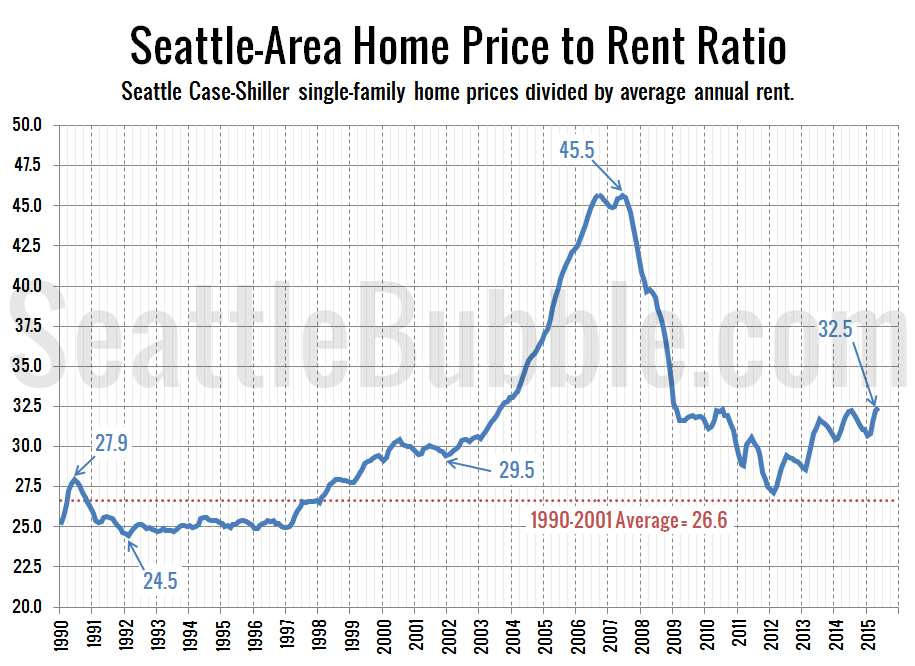
It’s been a while since we took a look at how rents are comparing to home prices in the Seattle area. Both home prices and rents have been climbing quite a bit in the Seattle area lately. We would expect this with a booming local economy, but if home price gains been significantly outpacing rent…

Share:

  • Twitter
  • LinkedIn
  • Facebook
  • Reddit
  • Pinterest
  • Email

Posts navigation

  • Previous
  • 1
  • …
  • 32
  • 33
  • 34
  • 35
  • 36
  • 37
  • 38
  • …
  • 145
  • Next

Tim’s Other Projects

Dispatches from the Multiverse

Tip Jar

Like what we're doing?

Drop us a tip!

Accounts

  • Log in
  • Entries feed
  • Comments feed
  • WordPress.org
©2024 Seattle Bubble | Built using WordPress and Responsive Blogily theme by Superb