Skip to content

Seattle Bubble

local real estate news, statistics, and commentary without the sales spin.

Menu
  • Home
  • About
  • Contact
  • Reference
  • Speaking
Menu

Category: Counties

County-wide statistics.

Seattle-Area Unemployment Dips to Previous Boom Levels

Posted on July 22, 2015July 24, 2015 by The Tim

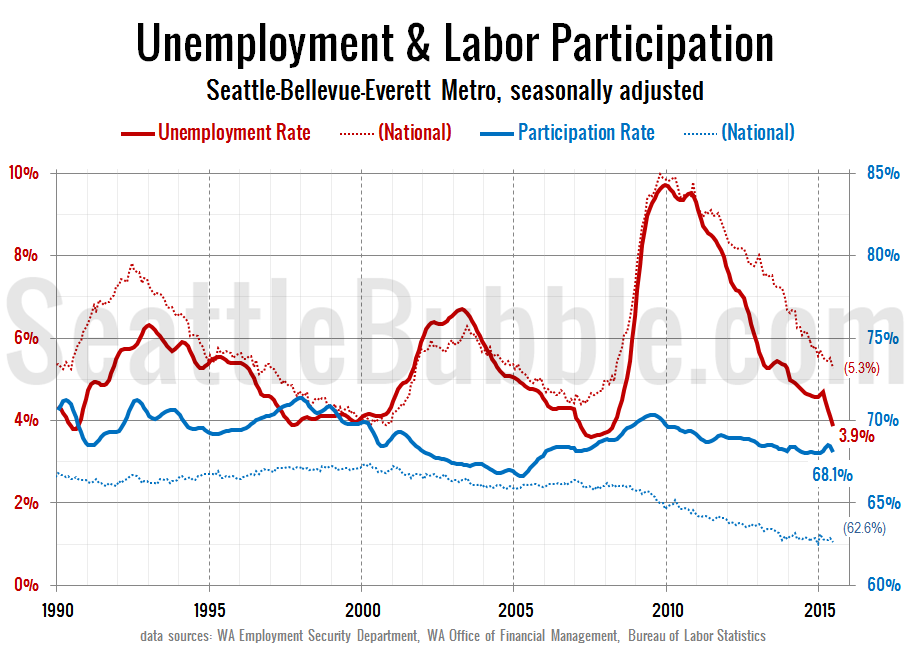
We haven’t taken a look at the jobs data in a while, so lets update those charts through June. In this series we look at how the Seattle area’s unemployment rate and approximate labor participation rate stack up to the national numbers. [July 24 Update – The chart above and numbers below have been updated…

Share:

  • Twitter
  • LinkedIn
  • Facebook
  • Reddit
  • Pinterest
  • Email

Despite Red-Hot Housing Market, One in Five Pending Sales Still Fail to Close

Posted on July 20, 2015July 22, 2015 by The Tim

With another quarter fully in the books, let’s take a look a the latest data on pending sales volume versus closed sales volume. For this series I roll the pending sales and closed sales data up by quarter, with pending sales offset by one month. In other words, the second quarter numbers below represent pending…

Share:

  • Twitter
  • LinkedIn
  • Facebook
  • Reddit
  • Pinterest
  • Email

King County Single Family Median Price Hits New Record at Half a Million Dollars

Posted on July 6, 2015July 8, 2015 by The Tim

June market stats were published by the NWMLS today. Before we get into our monthly stats, here’s a quick look at their press release. Home sales sizzling around Western Washington, with volumes reaching 10-year high Temperatures around Western Washington were not the only thing sizzling during June. Northwest Multiple Listing Service members reported 11,453 pending…

Share:

  • Twitter
  • LinkedIn
  • Facebook
  • Reddit
  • Pinterest
  • Email

June Stats Preview: Sales Spike Up Sharply

Posted on July 3, 2015July 7, 2015 by The Tim

Now that June is behind us, let’s have a look at our monthly stats preview. First up, here’s the snapshot of all the data as far back as my historical information goes, with the latest, high, and low values highlighted for each series: Sales shot up to a multi-year high in both counties, inventory barely…

Share:

  • Twitter
  • LinkedIn
  • Facebook
  • Reddit
  • Pinterest
  • Email

Case-Shiller Tiers: All Three Tiers Increase Strongly in April

Posted on July 2, 2015July 2, 2015 by The Tim

Let’s check out the three price tiers for the Seattle area, as measured by Case-Shiller. Remember, Case-Shiller’s “Seattle” data is based on single-family home repeat sales in King, Pierce, and Snohomish counties. Note that the tiers are determined by sale volume. In other words, 1/3 of all sales fall into each tier. For more details…

Share:

  • Twitter
  • LinkedIn
  • Facebook
  • Reddit
  • Pinterest
  • Email

Posts navigation

  • Previous
  • 1
  • …
  • 34
  • 35
  • 36
  • 37
  • 38
  • 39
  • 40
  • …
  • 145
  • Next

Tim’s Other Projects

Dispatches from the Multiverse

Tip Jar

Like what we're doing?

Drop us a tip!

Accounts

  • Log in
  • Entries feed
  • Comments feed
  • WordPress.org
©2024 Seattle Bubble | Built using WordPress and Responsive Blogily theme by Superb