Skip to content

Seattle Bubble

local real estate news, statistics, and commentary without the sales spin.

Menu
  • Home
  • About
  • Contact
  • Reference
  • Speaking
Menu

Category: Counties

County-wide statistics.

Year-Over-Year Price Gains Rapidly Descending to Earth

Posted on July 31, 2014July 31, 2014 by The Tim

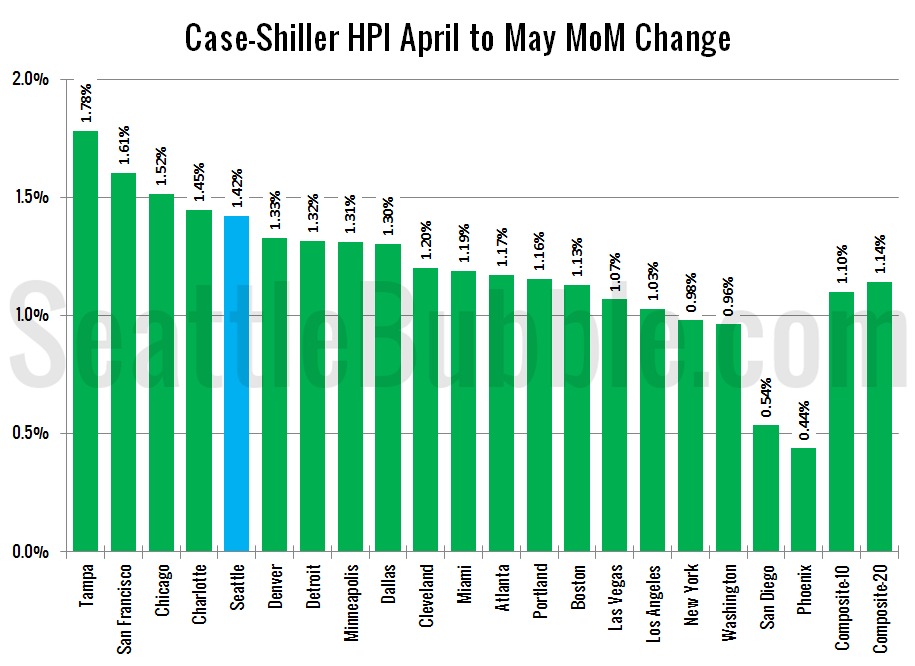
Let’s take one more look at this week’s Case-Shiller data. Specifically, the rate of change in the year-over-year rate of change, also known as the second derivative. First, let’s take a look at the direction the second derivative is moving in the 20 cities tracked by Case-Shiller. In this chart green dots represent cities with…

Share:

  • Twitter
  • LinkedIn
  • Facebook
  • Reddit
  • Pinterest
  • Email

Case-Shiller Tiers: Softer May in All Three Tiers

Posted on July 30, 2014July 29, 2014 by The Tim

Let’s check out the three price tiers for the Seattle area, as measured by Case-Shiller. Remember, Case-Shiller’s “Seattle” data is based on single-family home repeat sales in King, Pierce, and Snohomish counties. Note that the tiers are determined by sale volume. In other words, 1/3 of all sales fall into each tier. For more details…

Share:

  • Twitter
  • LinkedIn
  • Facebook
  • Reddit
  • Pinterest
  • Email

Case-Shiller: Home Price Growth Cooled in May

Posted on July 29, 2014 by The Tim

Let’s have a look at the latest data from the Case-Shiller Home Price Index. According to April data, Seattle-area home prices were: Up 1.4% April to May Up 9.3% YOY. Down 12.6% from the July 2007 peak Last year prices rose 3.1% from April to May and year-over-year prices were up 11.9%. Although prices are…

Share:

  • Twitter
  • LinkedIn
  • Facebook
  • Reddit
  • Pinterest
  • Email

Seattle Unemployment at 6-Year Low in June

Posted on July 24, 2014July 24, 2014 by The Tim

Let’s have a look at the jobs data for June and how the Seattle area’s unemployment rate and approximate labor participation rate alongside the national numbers. In June the Seattle area’s unemployment rate hit its lowest level in almost six years. June’s 4.8 percent unemployment rate was comparable to the 4.7 percent level in August…

Share:

  • Twitter
  • LinkedIn
  • Facebook
  • Reddit
  • Pinterest
  • Email

Around the Sound: King & Snohomish Buck Sales Trend

Posted on July 23, 2014July 23, 2014 by The Tim

It’s time for us to check up on stats outside of the King/Snohomish core with our “Around the Sound” statistics for Pierce, Kitsap, Thurston, Island, Skagit, and Whatcom counties. If there is certain data you would like to see or ways you would like to see the data presented differently, drop a comment below and…

Share:

  • Twitter
  • LinkedIn
  • Facebook
  • Reddit
  • Pinterest
  • Email

Posts navigation

  • Previous
  • 1
  • …
  • 49
  • 50
  • 51
  • 52
  • 53
  • 54
  • 55
  • …
  • 145
  • Next

Tim’s Other Projects

Dispatches from the Multiverse

Tip Jar

Like what we're doing?

Drop us a tip!

Accounts

  • Log in
  • Entries feed
  • Comments feed
  • WordPress.org
©2024 Seattle Bubble | Built using WordPress and Responsive Blogily theme by Superb