Skip to content

Seattle Bubble

local real estate news, statistics, and commentary without the sales spin.

Menu
  • Home
  • About
  • Contact
  • Reference
  • Speaking
Menu

Category: Counties

County-wide statistics.

Bank-Owned Sales Inched Down Again in April

Posted on May 14, 2013May 14, 2013 by The Tim

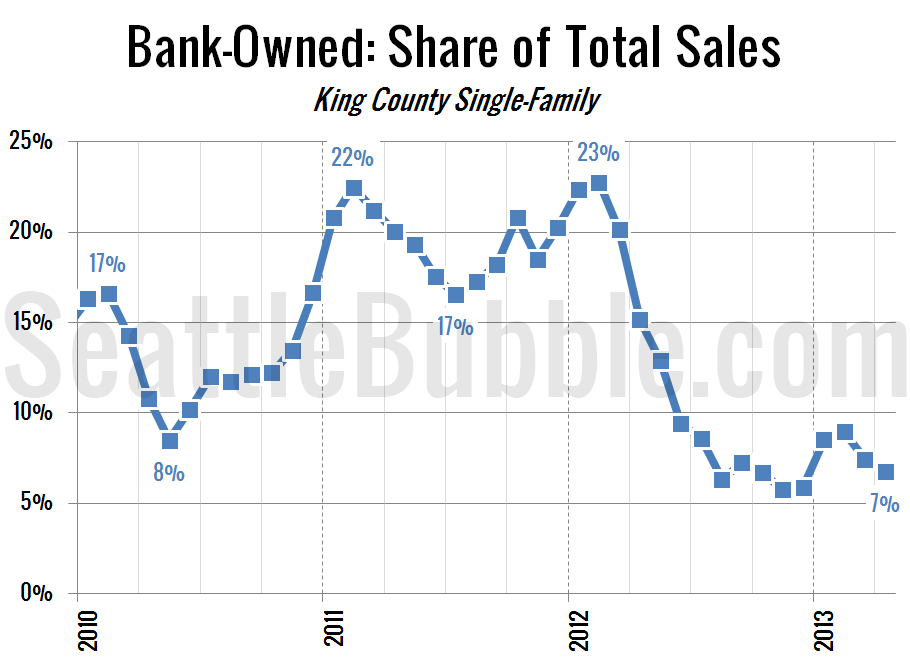
Let’s take another look at what share of the monthly sales are being distressed sales—bank-owned and short sales. In April 2012 15.2% of the sales of single-family homes in King County were bank-owned. In April 2013 that number was just 6.8%. The low point of the last few years was 5.7% in November. I wouldn’t…

Share:

  • Twitter
  • LinkedIn
  • Facebook
  • Reddit
  • Pinterest
  • Email

Foreclosures Still Shrinking Around Seattle

Posted on May 10, 2013May 10, 2013 by The Tim

It’s time for our detailed look at April’s foreclosure stats in King, Snohomish, and Pierce counties. First up, the Notice of Trustee Sale summary: April 2013 King: 746 NTS, up 69% YOY Snohomish: 420 NTS, up 53% YOY Pierce: 598 NTS, up 124% YOY Same story as most of this year: still above last year’s…

Share:

  • Twitter
  • LinkedIn
  • Facebook
  • Reddit
  • Pinterest
  • Email

NWMLS: Inventory Inched Up in April

Posted on May 6, 2013May 6, 2013 by The Tim

March market stats were published by the NWMLS this morning. Here’s a snippet from their press release: Multiple offers are "the new normal" for housing market around Puget Sound. “Multiple offers have become the new normal,” remarked MLS director Diedre Haines, the Snohomish County regional managing broker at Coldwell Banker Bain. “We have literally gone…

Share:

  • Twitter
  • LinkedIn
  • Facebook
  • Reddit
  • Pinterest
  • Email

April Stats Preview: Finally Some Inventory Edition

Posted on May 2, 2013May 2, 2013 by The Tim

With April 2013 in the history books, let’s have a look at our stats preview. Most of the charts below are based on broad county-wide data that is available through a simple search of King County and Snohomish County public records. If you have additional stats you’d like to see in the preview, drop a…

Share:

  • Twitter
  • LinkedIn
  • Facebook
  • Reddit
  • Pinterest
  • Email

Case-Shiller Tiers: Low Tier Gains, Middle Tier Loses

Posted on May 1, 2013April 30, 2013 by The Tim

Let’s check out the three price tiers for the Seattle area, as measured by Case-Shiller. Remember, Case-Shiller’s “Seattle” data is based on single-family home repeat sales in King, Pierce, and Snohomish counties. Note that the tiers are determined by sale volume. In other words, 1/3 of all sales fall into each tier. For more details…

Share:

  • Twitter
  • LinkedIn
  • Facebook
  • Reddit
  • Pinterest
  • Email

Posts navigation

  • Previous
  • 1
  • …
  • 77
  • 78
  • 79
  • 80
  • 81
  • 82
  • 83
  • …
  • 145
  • Next

Tim’s Other Projects

Dispatches from the Multiverse

Tip Jar

Like what we're doing?

Drop us a tip!

Accounts

  • Log in
  • Entries feed
  • Comments feed
  • WordPress.org
©2024 Seattle Bubble | Built using WordPress and Responsive Blogily theme by Superb