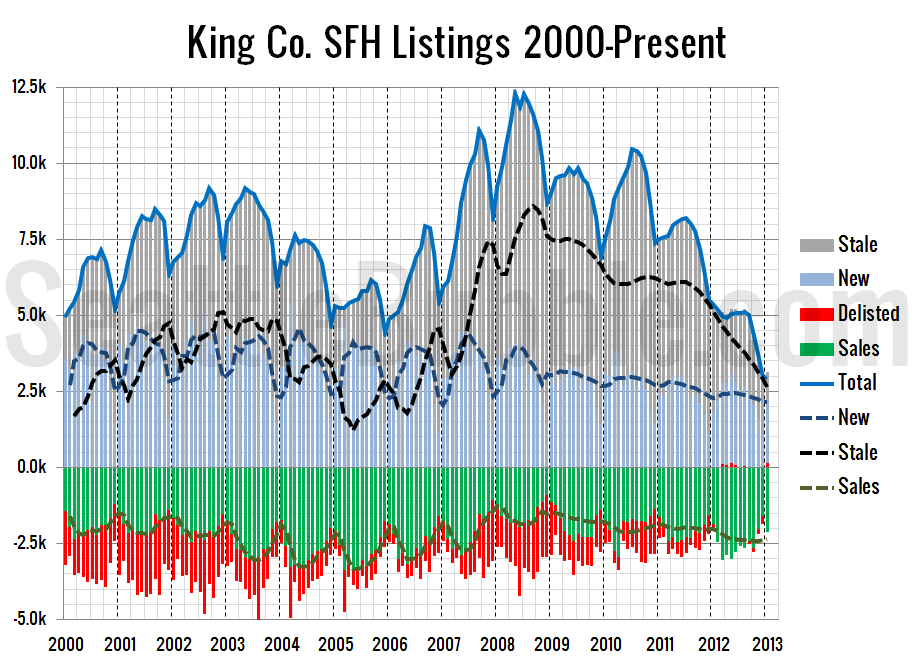
Here’s a view on listings that we haven’t visited in a while. In this chart I use the NWMLS-published data on new listings, pending sales, and total inventory to visualize the inflow and outflow of single-family listings in King County. First up is a chart that goes back as far as NWMLS data is available:…
Category: Counties
County-wide statistics.
Expensive Home Sales Dropped Off Dramatically in January
Let’s have another look at our monthly sales histogram. After flattening out somewhat between November and December the sales distribution curve became much steeper in January as sales above $300,000 fell off dramatically. In December the mode (i.e. the bucket with the most sales) for non-distressed sales was at $350,000 to $400,000, but in January…
Foreclosures Start 2013 Elevated
It’s time once again to expand on our preview of foreclosure activity with a more detailed look at January’s stats in King, Snohomish, and Pierce counties. First up, the Notice of Trustee Sale summary: January 2013 King: 1,060 NTS, up 154% YOY Snohomish: 566 NTS, up 141% YOY Pierce: 723 NTS, up 156% YOY All…
Non-Distressed Median House Price Was Flat in January
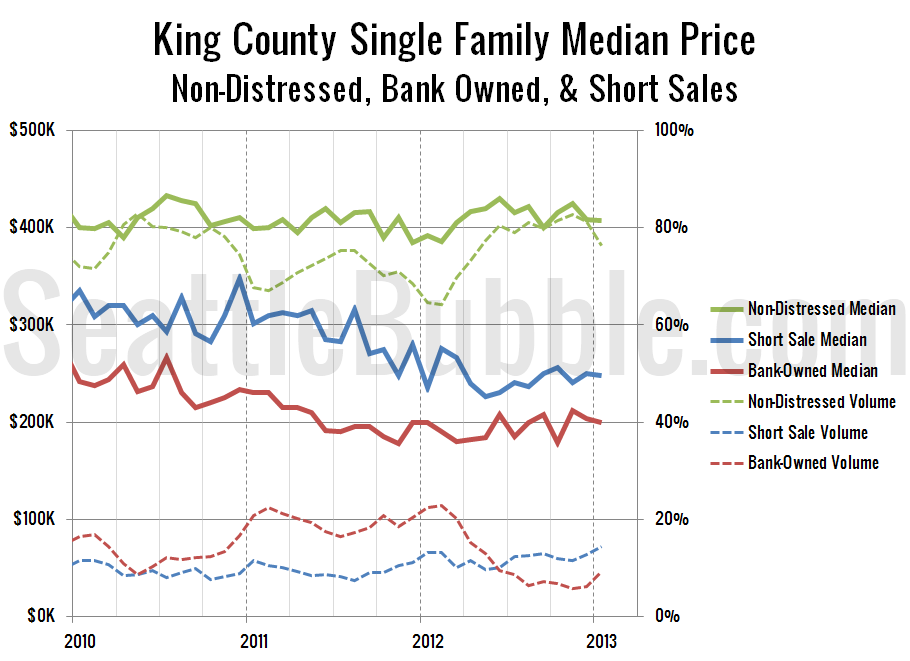
As promised on yesterday, it’s time to check up on median home sale prices broken down by distress status: Non-distressed, bank-owned, and short sales. As of January, the non-distressed median price for King County single family home sales sits at $407,000, up 3.8% from a year earlier and virtually flat from December (down $1,000). This…
Distressed Sales Finally Saw a Winter Spike in January
Let’s take another look at what share of the monthly sales are being taken up by bank-owned and short sales. In January 2012 22.3% of the sale of single-family homes in King County were bank-owned. In January 2013 that number was just 9.3%. Although the number is much lower than it was a year ago,…


