Let’s have another look at our monthly sales histogram. The sales distribution curve flattened out a bit between November and December, with low-priced homes inching up and many of the high-price buckets dropping a bit. In November the mode (i.e. the bucket with the most sales) for non-distressed sales was at $350,000 to $400,000, with…
Category: Counties
County-wide statistics.
Non-Distressed Median Up 6.5% in December
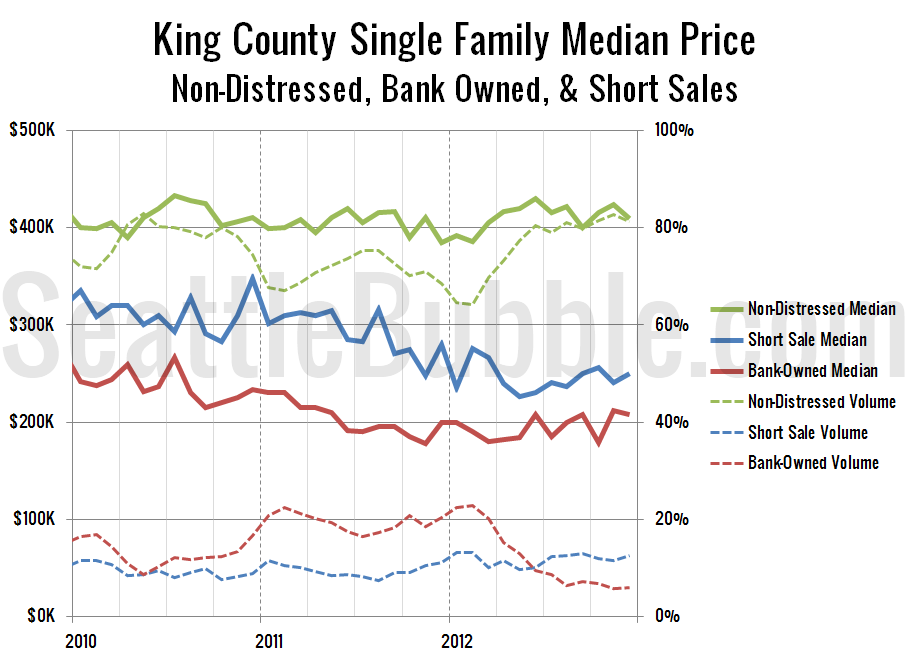
As promised on Wednesday, it’s time to check up on median home sale prices broken down by distress status: Non-distressed, bank-owned, and short sales. As of December, the non-distressed median price for King County single family home sales sits at $409,475, up 6.5% from a year earlier. An increase of 6.5% year-over-year is pretty strong,…
Foreclosures Spike Up to Close 2012
It’s time once again to expand on our preview of foreclosure activity with a more detailed look at December’s stats in King, Snohomish, and Pierce counties. First up, the Notice of Trustee Sale summary: December 2012 King: 1,031 NTS, up 198.8% YOY Snohomish: 609 NTS, up 278.3% YOY Pierce: 770 NTS, up 237.7% YOY All…
Bank-Owned Sales Skip Usual Winter Boost
Let’s take another look at what share of the monthly sales are being taken up by bank-owned and short sales. In December 2011 20.3% of the sale of single-family homes in King County were bank-owned. In December 2012 that number was just 6.0%. I keep thinking this number will go up as more traditional sellers…
New Listings Drop 25% From 2012’s Already-Depressed Level
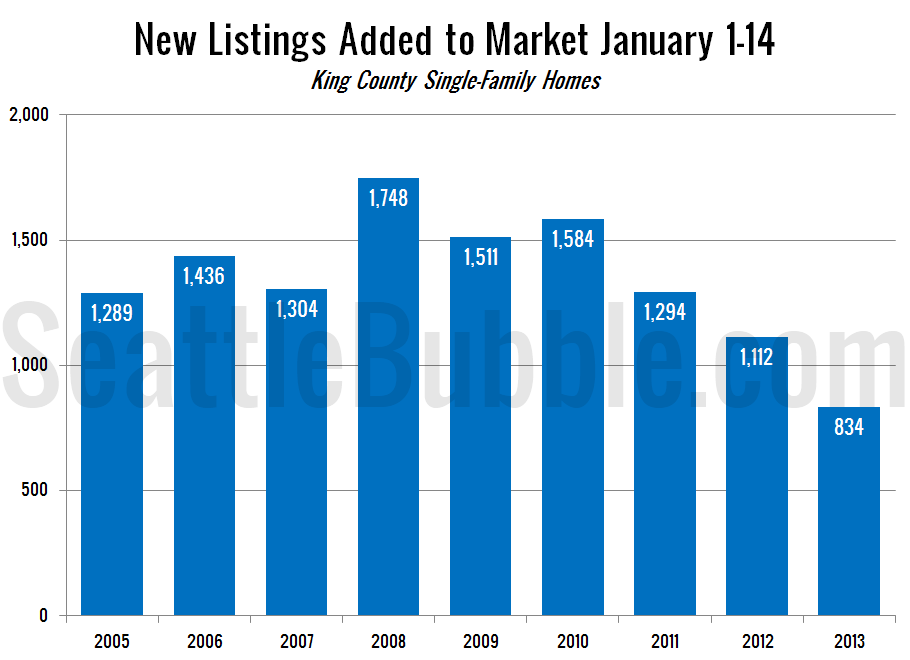
Well, this is just depressing: After the first two full weeks of the year, new listings of single family homes in King County are down 25% from last year. This follows a 14% drop last year and an 18% drop the year before that. For buyers who were hoping that the new year would bring…


