It has been a while since we had a look at the local affordability index, and now that we’ve got all of the data for 2012, it seemed like a good time to take another look. As a reminder, the affordability index is based on three factors: median single-family home price as reported by the…
Category: Statistics
Statistics, number-based analysis, etc.
NWMLS: 2012 Ends on a Sour Note for Buyers
December market stats were published by the NWMLS this morning. Here’s a snippet from their press release: Northwest MLS Tallies Busy December as First-time Buyers, Investors Return. Brokers expect the housing market rebound to continue, while cautioning sellers to refrain from becoming too greedy and expressing hope for “controlled natural growth” to sustain the recovery….
December Stats Preview: Foreclosure Surge Edition
With the last month of 2012 now behind us, let’s have a look at our stats preview. Most of the charts below are based on broad county-wide data that is available through a simple search of King County and Snohomish County public records. If you have additional stats you’d like to see in the preview,…

Case-Shiller Tiers: High & Low Tier Begin Seasonal Decline
Let’s check out the three price tiers for the Seattle area, as measured by Case-Shiller. Remember, Case-Shiller’s “Seattle” data is based on single-family home repeat sales in King, Pierce, and Snohomish counties. Note that the tiers are determined by sale volume. In other words, 1/3 of all sales fall into each tier. For more details…
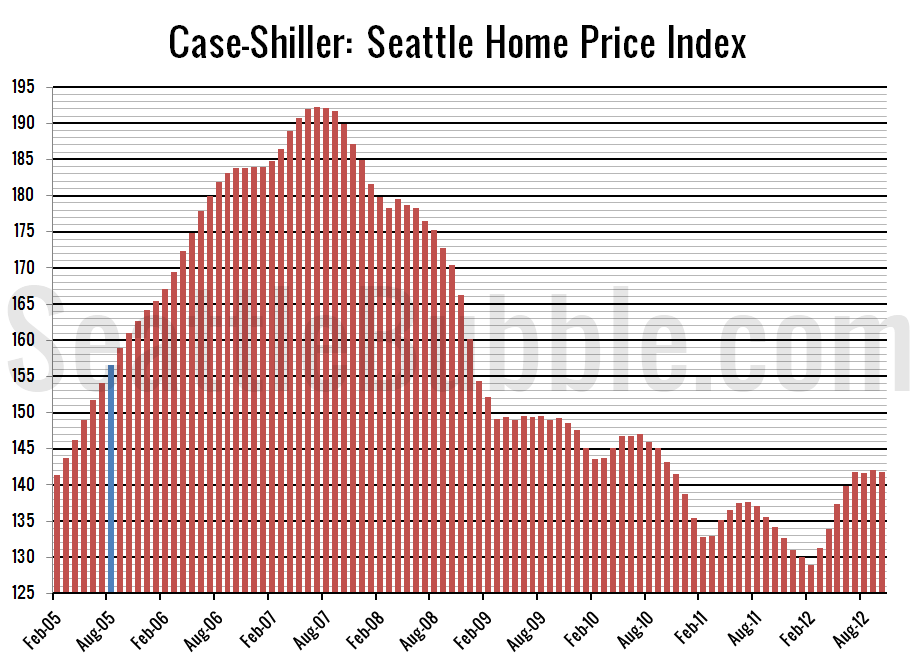
Case-Shiller: Yearly Price Gain Increased Again in October
Let’s have a look at the latest data from the Case-Shiller Home Price Index. According to October data, Seattle-area home prices were: Down 0.2% September to October. Up 5.7% YOY. Down 26.3% from the July 2007 peak Last year prices fell 1.0% from September to October and year-over-year prices were down 6.2%. Nothing surprising here….