It’s time once again to expand on our preview of foreclosure activity with a more detailed look at February’s stats in King, Snohomish, and Pierce counties. First up, the Notice of Trustee Sale summary: February 2012 King: 453 NTS, down 50.9% YOY Snohomish: 246 NTS, down 47.1% YOY Pierce: 285 NTS, down 47.2% YOY All…
Category: Statistics
Statistics, number-based analysis, etc.

Dude, Where’s My Inventory?
If a picture is worth a thousand words, I guess these three charts of King County single-family home stats make this about a three thousand word post. Seriously though… Where’s the inventory?
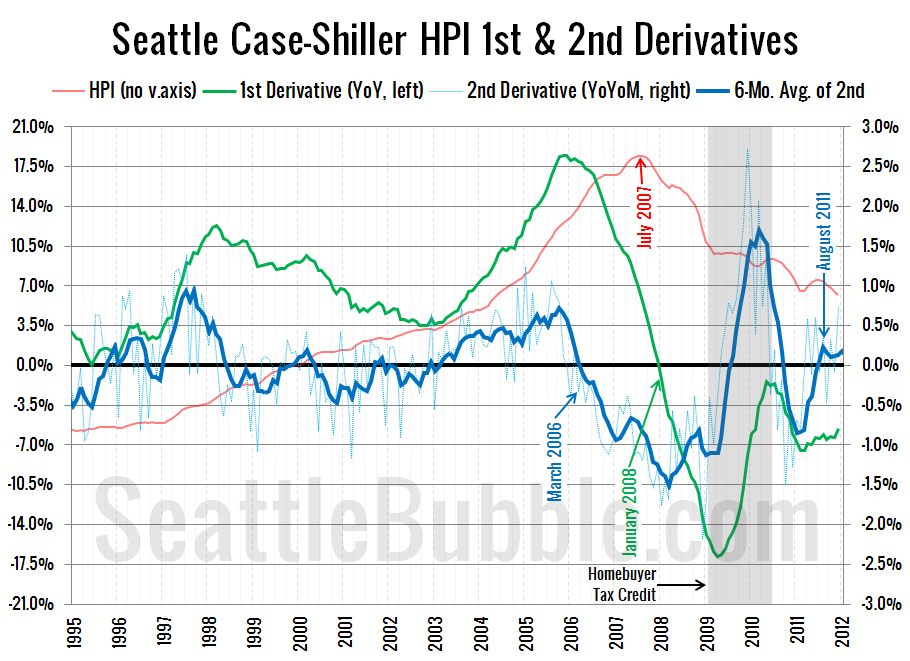
Second Derivative Suggests Imminent Price Stabilization
At the risk of getting a little too technical and going off the quant deep end, I wanted to explore a different view of the Case-Shiller home price data that I haven’t shared on here before. Typically when we look at the Case-Shiller home price data on here, we look at three things: The raw…
NWMLS: Inventory Shrinks, Sales Climb, Bleeding Slows
February market stats have been compiled by the NWMLS. Their press release isn’t up yet, but you can read it here once they do publish it. Since we don’t have any amusing prose to poke at, we’ll just dive right into the stats and save the response to their salesmanship for tomorrow’s Reporting Roundup. CAUTION…
February Stats Preview: Surprise Sales Spike Edition?
With another leap day behind us, it’s time to take an early look at February’s stats. Most of the charts below are based on broad county-wide data that is available through a simple search of King County and Snohomish County public records. If you have additional stats you’d like to see in the preview, drop…