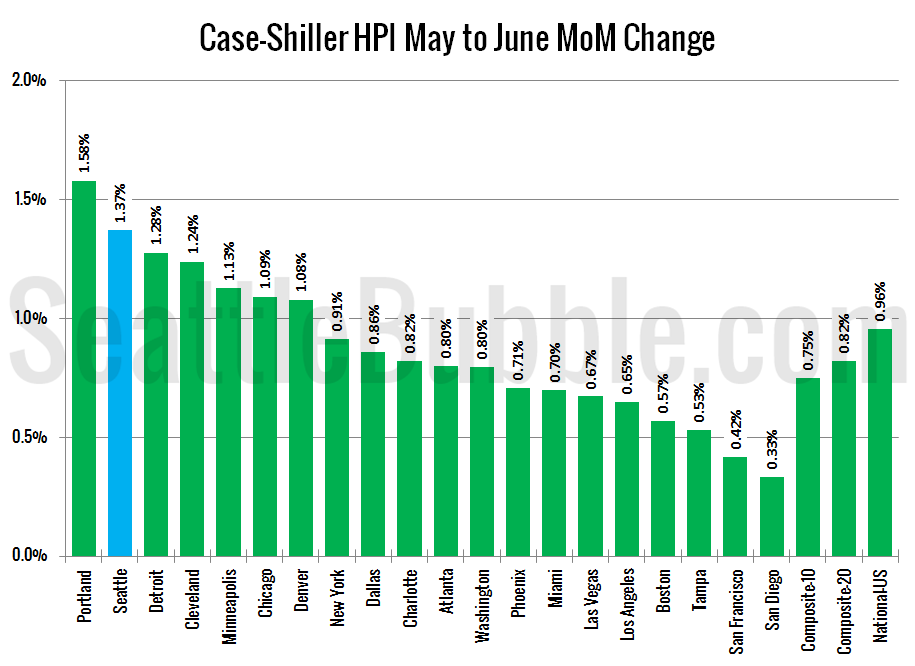
Let’s have a look at the latest data from the Case-Shiller Home Price Index. According to June data that was released this morning, Seattle-area home prices were: Up 1.4 percent May to June Up 11.0 percent YOY. Up 5.3 percent from the July 2007 peak Over the same period last year prices were up 1.0…
Category: Statistics
Statistics, number-based analysis, etc.
Around the Sound: Sales Slip In More Counties
Get access to the full spreadsheets used to make the charts in this and other posts, and support the ongoing work on this site by becoming a member of Seattle Bubble. Let’s have a look at our housing stats for the broader Puget Sound area. Here’s your July update to our “Around the Sound” statistics…
NWMLS: Listings Inch Up, Sales Dip, Prices Slip
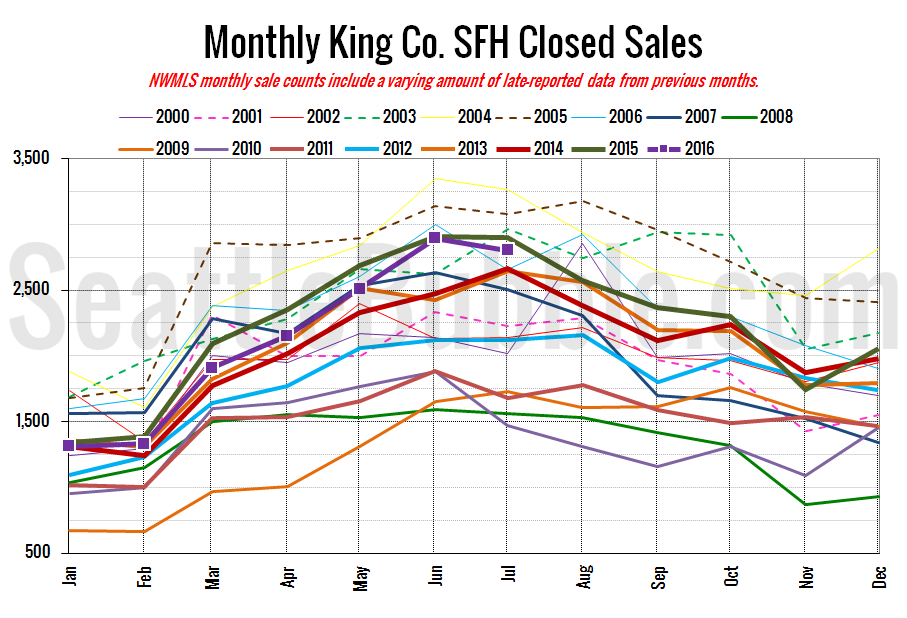
Get access to the full spreadsheets used to make the charts in this and other posts, as well as a variety of additional insider benefits by becoming a member of Seattle Bubble. July market stats were published by the NWMLS yesterday. Here’s an excerpt from the NWMLS press release: Some Brokers See Early Signs of…
July Stats Preview: The Inventory Bleeding Stops
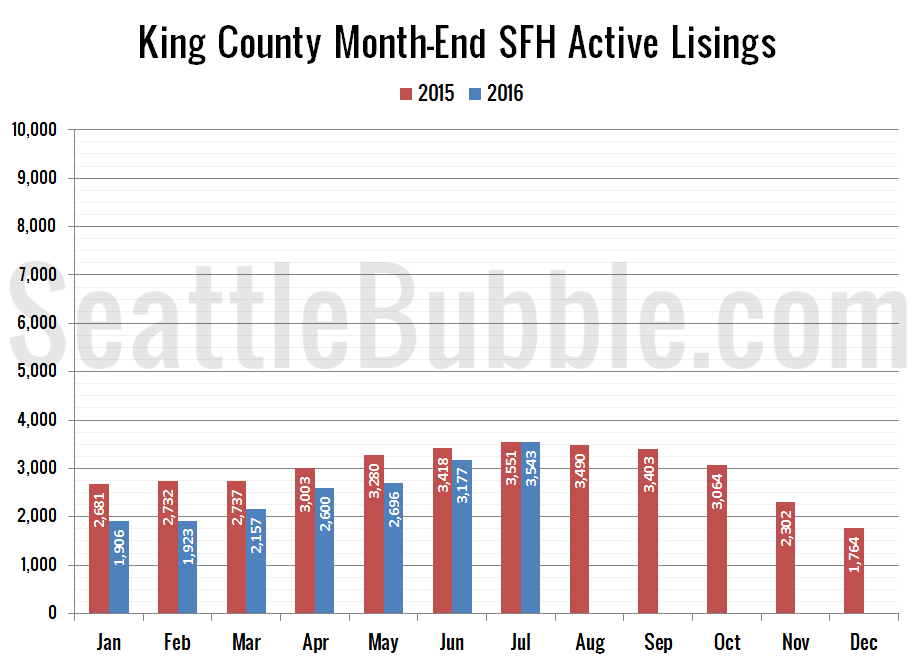
Get access to the full spreadsheets used to make the charts in this and other posts, and support the ongoing work on this site by becoming a member of Seattle Bubble. With July officially in the books, let’s have our first look at how the month’s real estate stats stack up. First up, here’s the…
Case-Shiller Tiers: High Tier Seven Percent Above 2007 Peak
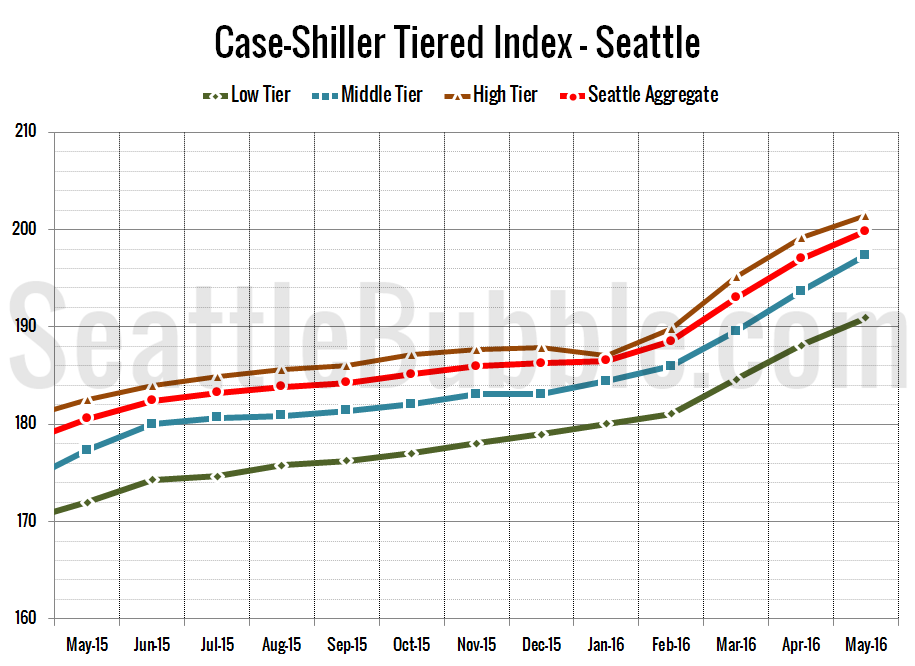
Let’s check out the three price tiers for the Seattle area, as measured by Case-Shiller. Remember, Case-Shiller’s “Seattle” data is based on single-family home repeat sales in King, Pierce, and Snohomish counties. Note that the tiers are determined by sale volume. In other words, 1/3 of all sales fall into each tier. For more details…


