Skip to content

Seattle Bubble

local real estate news, statistics, and commentary without the sales spin.

Menu
  • Home
  • About
  • Contact
  • Reference
  • Speaking
Menu

Category: Statistics

Statistics, number-based analysis, etc.

November Stats Preview: Where Did the Listings Go?

Posted on December 1, 2015January 4, 2016 by The Tim

November has come and gone, so let’s have a look at our monthly stats preview. First up, here’s the snapshot of all the data as far back as my historical information goes, with the latest, high, and low values highlighted for each series:

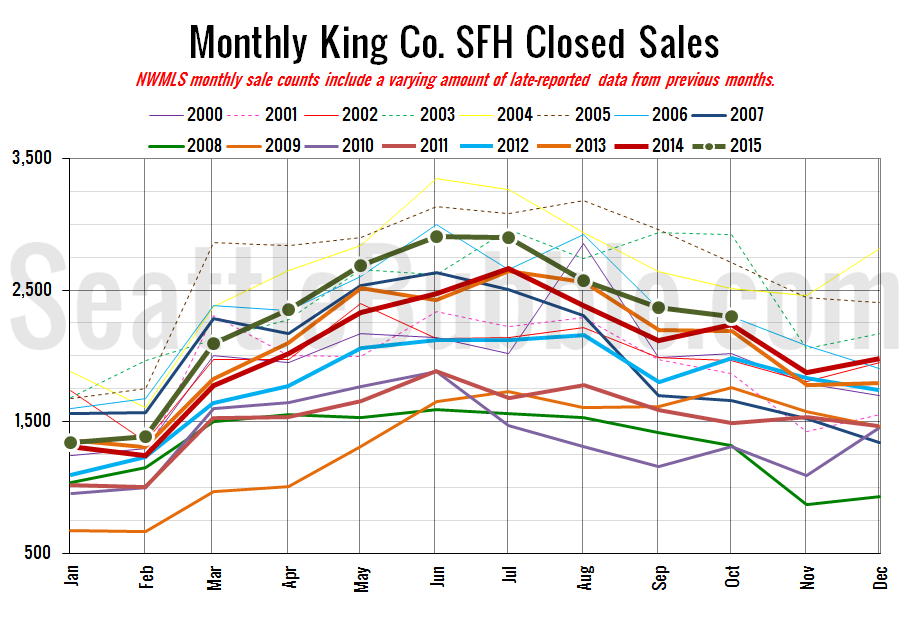
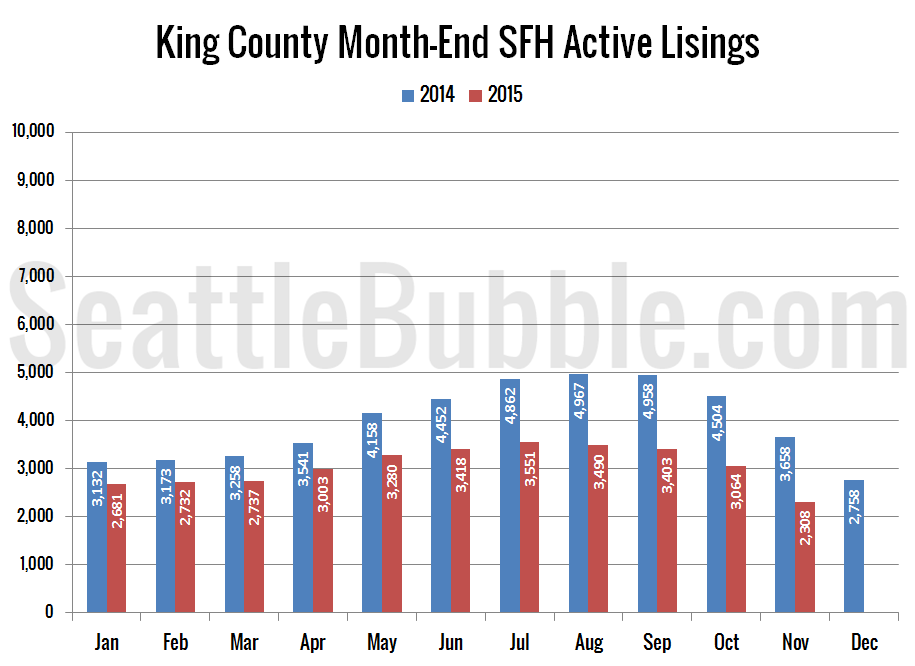
Sales dropped significantly month-over-month, as is typical for this time of year. Inventory also fell, which is also normal for the season, but the month-over-month drop in homes for sale was the largest on record (since 2000) in both King and Snohomish Counties. Foreclosure notices in both counties were down from a month earlier…

Share:

  • Twitter
  • LinkedIn
  • Facebook
  • Reddit
  • Pinterest
  • Email

Case-Shiller Tiers: High Tier Nearly Back to Peak Pricing

Posted on November 25, 2015December 1, 2015 by The Tim

Let’s check out the three price tiers for the Seattle area, as measured by Case-Shiller. Remember, Case-Shiller’s “Seattle” data is based on single-family home repeat sales in King, Pierce, and Snohomish counties.

All three tiers were up month-over-month yet again in September, however in the low and high tiers the gains were considerably smaller than a month earlier. The high tier saw the smallest gain of the group…

Share:

  • Twitter
  • LinkedIn
  • Facebook
  • Reddit
  • Pinterest
  • Email

Case-Shiller: Seattle Home Prices Strong in September

Posted on November 24, 2015November 25, 2015 by The Tim

Let’s have a look at the latest data from the Case-Shiller Home Price Index. According to August data that was released today, Seattle-area home prices were:

Up 0.2 percent August to September
Up 8.2 percent YOY…

Share:

  • Twitter
  • LinkedIn
  • Facebook
  • Reddit
  • Pinterest
  • Email

Low Interest Rates Barely Keep Affordability Reasonable

Posted on November 23, 2015November 24, 2015 by The Tim

Let’s have an updated look at our affordability index charts for the counties around Puget Sound.

As of October, affordability is still bad, but not terrible for home buyers. Median home prices have dipped just slightly in the last few months…

Share:

  • Twitter
  • LinkedIn
  • Facebook
  • Reddit
  • Pinterest
  • Email

NWMLS: Sales Slip Slightly from September to October

Posted on November 6, 2015November 12, 2015 by The Tim

October market stats were published by the NWMLS yesterday. I continue to be surprised that prices are not up 10 to 20 percent year-over-year, with the strong sales and weak inventory numbers we’ve seen all year…

Share:

  • Twitter
  • LinkedIn
  • Facebook
  • Reddit
  • Pinterest
  • Email

Posts navigation

  • Previous
  • 1
  • …
  • 30
  • 31
  • 32
  • 33
  • 34
  • 35
  • 36
  • …
  • 222
  • Next

Tim’s Other Projects

Dispatches from the Multiverse

Tip Jar

Like what we're doing?

Drop us a tip!

Accounts

  • Log in
  • Entries feed
  • Comments feed
  • WordPress.org
©2024 Seattle Bubble | Built using WordPress and Responsive Blogily theme by Superb
Menu
  • Home
  • About
  • Contact
  • Reference
  • Speaking