Skip to content

Seattle Bubble

local real estate news, statistics, and commentary without the sales spin.

Menu
  • Home
  • About
  • Contact
  • Reference
  • Speaking
Menu

Category: Statistics

Statistics, number-based analysis, etc.

October Stats Preview: Early Sales Dropoff Edition

Posted on November 3, 2015November 12, 2015 by The Tim

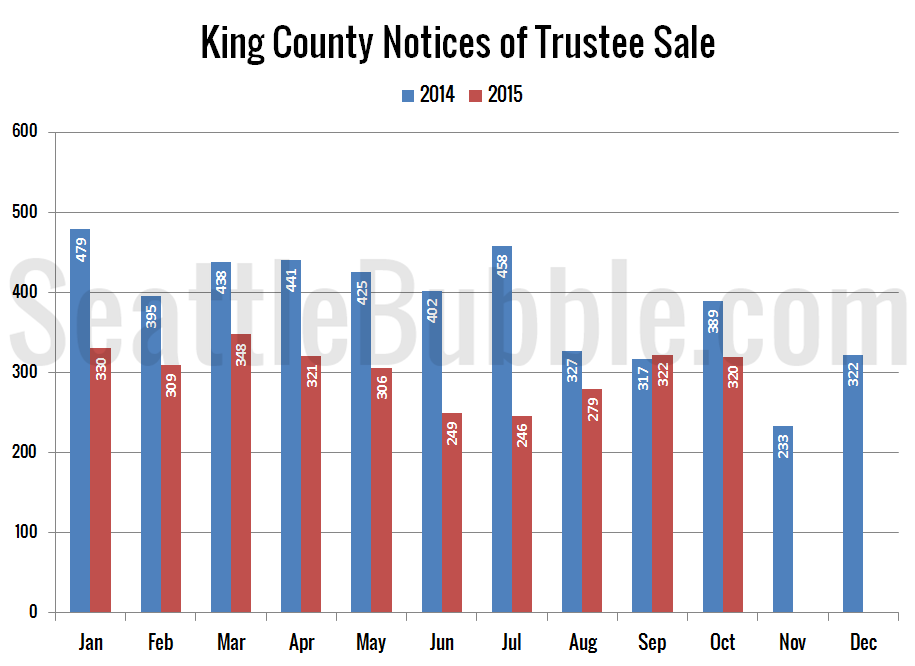
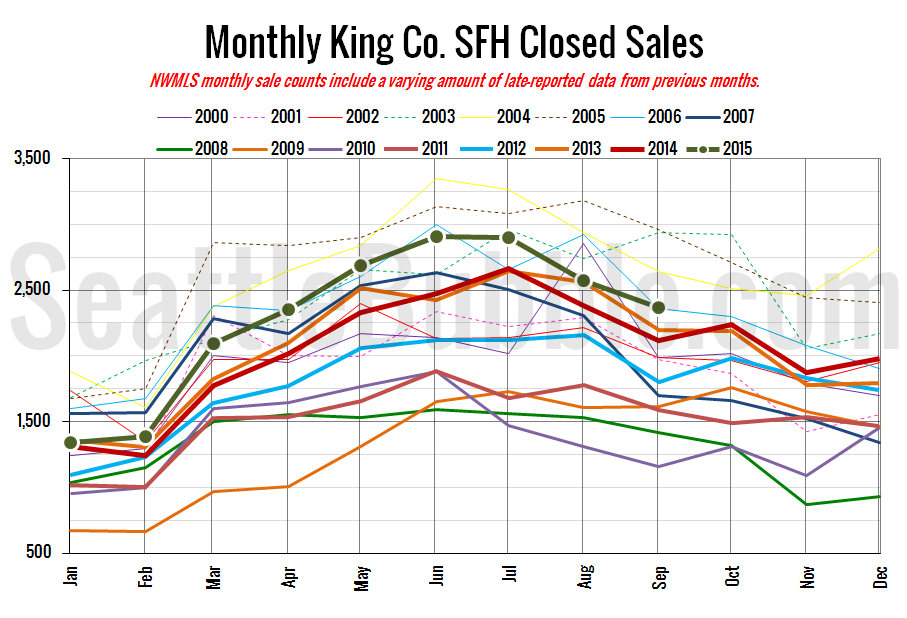
Sales dropped off a decent amount month-over-month, during a time when they rose a year ago, so the year-over-year growth fell off dramatically. Meanwhile inventory in both counties saw another year-over-year decline that was the biggest in two and a half years. Foreclosure notices in both counties were down slightly month-over-month and year-over-year.

Share:

  • Twitter
  • LinkedIn
  • Facebook
  • Reddit
  • Pinterest
  • Email

Case-Shiller Tiers: Low Tier Prices Increasing Fastest

Posted on October 30, 2015November 3, 2015 by The Tim

Let’s check out the three price tiers for the Seattle area, as measured by Case-Shiller. Remember, Case-Shiller’s “Seattle” data is based on single-family home repeat sales in King, Pierce, and Snohomish counties. Note that the tiers are determined by sale volume. In other words, 1/3 of all sales fall into each tier. For more details…

Share:

  • Twitter
  • LinkedIn
  • Facebook
  • Reddit
  • Pinterest
  • Email

Case-Shiller: Prices Gains Slow Slightly in August

Posted on October 27, 2015October 30, 2015 by The Tim

Let’s have a look at the latest data from the Case-Shiller Home Price Index. According to August data that was released today, Seattle-area home prices were: Up 0.3 percent July to August Up 7.6 percent YOY. Down 4.4 percent from the July 2007 peak Last year at this time prices were flat month-over-month and year-over-year…

Share:

  • Twitter
  • LinkedIn
  • Facebook
  • Reddit
  • Pinterest
  • Email

Seattle Housing Market Hotter Than Ever in 2015

Posted on October 21, 2015October 26, 2015 by The Tim

I’d like to introduce a new chart. The “Residential Real Estate Heat Index” is an index I’ve been calculating for a few years, that originally was part of the now-defunct Sound Housing Quarterly newsletter. It rolls changes in the median price, new listings, total inventory, pending sales and closed sales all into a single number to measure the relative “heat” of the market.

Here’s what it looks like for King County single-family homes and condos…

Share:

  • Twitter
  • LinkedIn
  • Facebook
  • Reddit
  • Pinterest
  • Email

NWMLS: Historic 2015 Seller’s Market Drags On

Posted on October 5, 2015October 26, 2015 by The Tim

September market stats were published by the NWMLS today. Before we get into our monthly stats, here’s a quick look at their press release…

Share:

  • Twitter
  • LinkedIn
  • Facebook
  • Reddit
  • Pinterest
  • Email

Posts navigation

  • Previous
  • 1
  • …
  • 31
  • 32
  • 33
  • 34
  • 35
  • 36
  • 37
  • …
  • 222
  • Next

Tim’s Other Projects

Dispatches from the Multiverse

Tip Jar

Like what we're doing?

Drop us a tip!

Accounts

  • Log in
  • Entries feed
  • Comments feed
  • WordPress.org
©2024 Seattle Bubble | Built using WordPress and Responsive Blogily theme by Superb