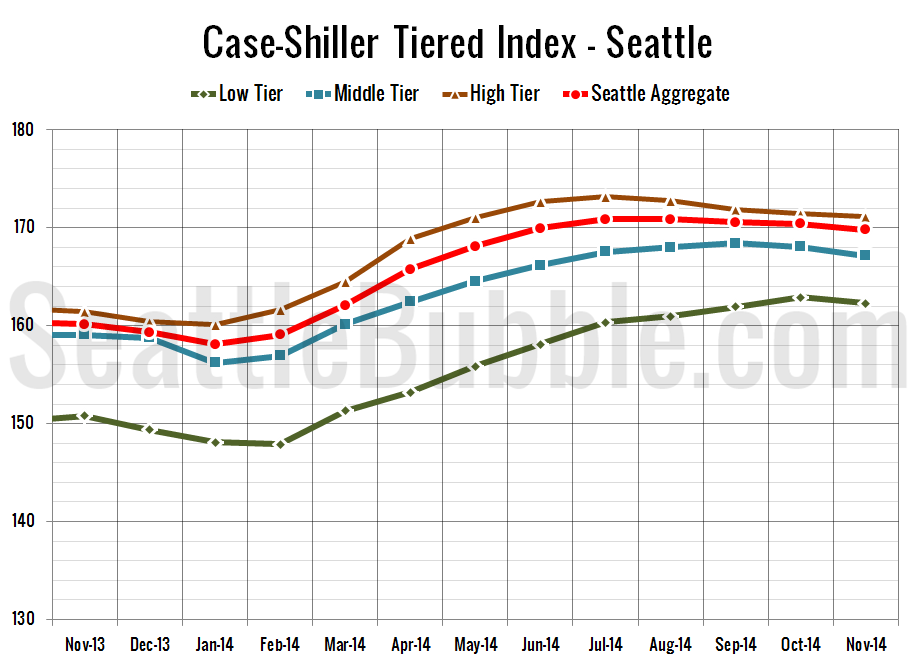
Let’s check out the three price tiers for the Seattle area, as measured by Case-Shiller. Remember, Case-Shiller’s “Seattle” data is based on single-family home repeat sales in King, Pierce, and Snohomish counties. Note that the tiers are determined by sale volume. In other words, 1/3 of all sales fall into each tier. For more details…
Category: Statistics
Statistics, number-based analysis, etc.
Case-Shiller: Home Prices Dipped in November
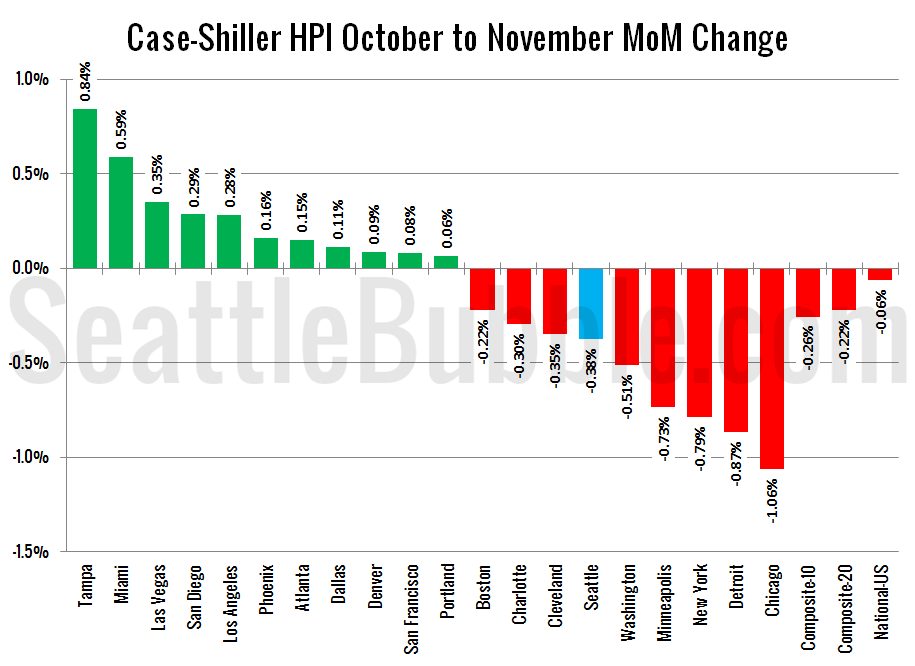
Let’s have a look at the latest data from the Case-Shiller Home Price Index. According to November data, Seattle-area home prices were: Down 0.4% October to November Up 6.0% YOY. Down 11.7% from the July 2007 peak Last year at this time prices fell 0.1% month-over-month and year-over-year prices were up 12.4%. Year-over-year price gains…
The Shadow Inventory Myth is Dead
A little over a year ago, I wrote a series of posts in which I argued that “shadow inventory” (foreclosed homes held off the market by the banks) was nearly non-existent. "Shadow Inventory" Conspiracy Theories Are Nonsense Shadow Inventory Gut Feelings, Rumors, & Anecdotes Undocumented Shadow Inventory Scarce in King County Despite all of the…
Foreclosures Almost Back to Pre-Bust Levels
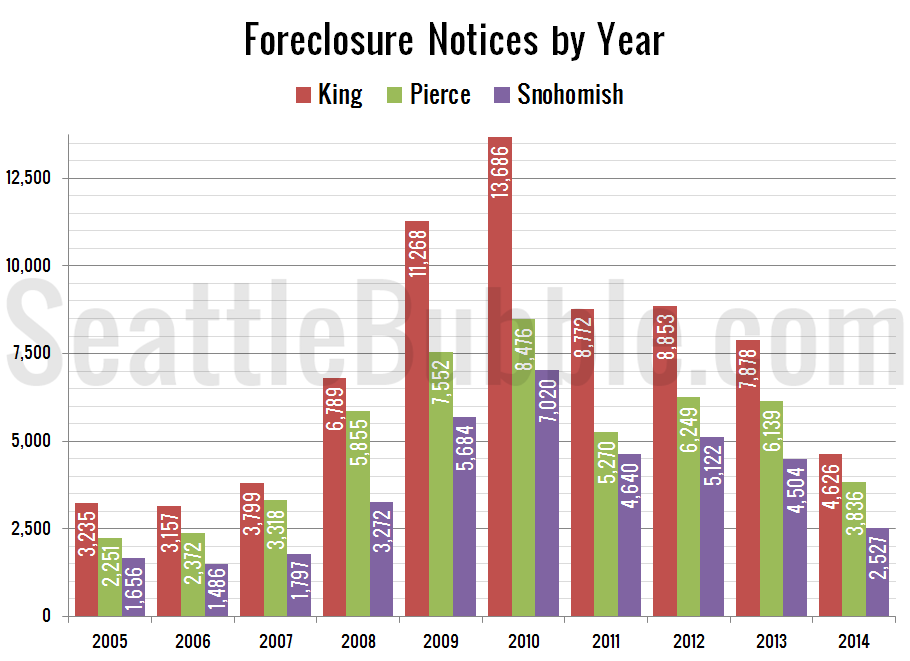
It’s time for our detailed look at December foreclosure stats in King, Snohomish, and Pierce counties. First up, the Notice of Trustee Sale summary: December 2014 King: 322 NTS, down 36% YOY Snohomish: 195 NTS, down 27% YOY Pierce: 298 NTS, down 21% YOY The number of trustee sale notices was down big yet again…
Eastside Prices Hit Another All-Time High in December
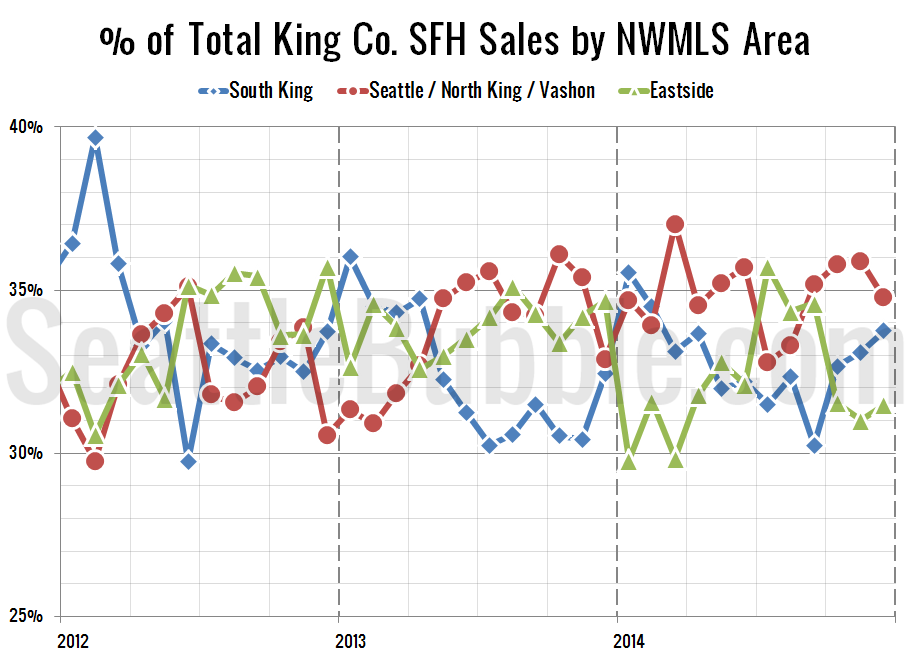
It’s time once again to take an updated look at how King County’s sales are shifting between the different regions around the county, since geographic shifts can and do affect the median price. In order to explore this concept, we break King County down into three regions, based on the NWMLS-defined “areas”: low end: South…


