Let’s check out the three price tiers for the Seattle area, as measured by Case-Shiller. Remember, Case-Shiller’s “Seattle” data is based on single-family home repeat sales in King, Pierce, and Snohomish counties. Note that the tiers are determined by sale volume. In other words, 1/3 of all sales fall into each tier. For more details…
Category: Statistics
Statistics, number-based analysis, etc.
Case-Shiller: Seattle Home Prices Begin the Autumn Decline Earlier Than Last Year
Let’s have a look at the latest data from the Case-Shiller Home Price Index. According to August data, Seattle-area home prices were: 0.0% Change July to August Up 6.6% YOY. Down 11.1% from the July 2007 peak Last year at this time prices were still rising. They increased 0.5% from July to August and year-over-year…
Around the Sound: Typical Seasonal Slowdown
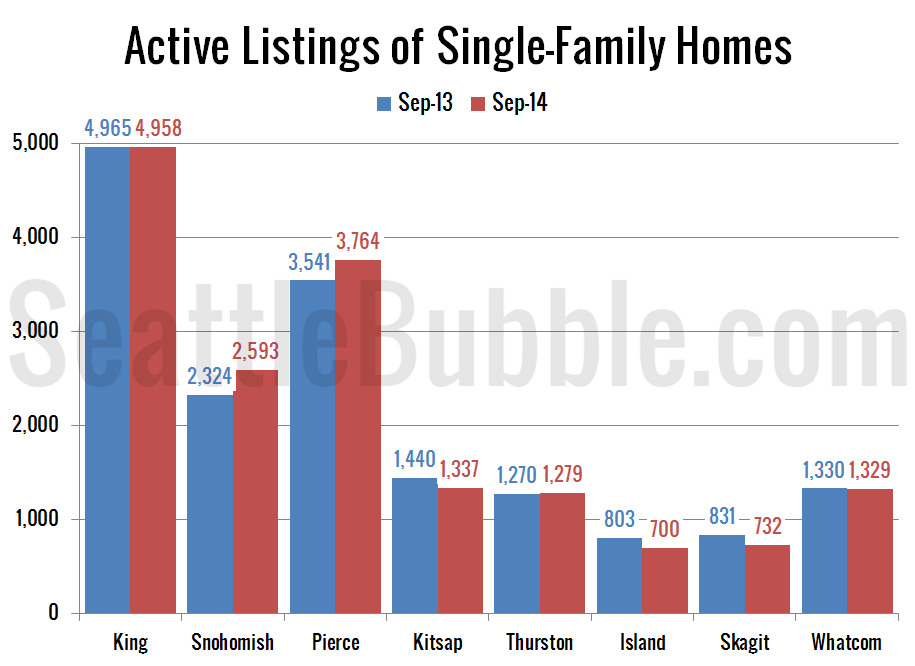
It’s time for us to check up on stats outside of the King/Snohomish core with our “Around the Sound” statistics for Pierce, Kitsap, Thurston, Island, Skagit, and Whatcom counties. If there is certain data you would like to see or ways you would like to see the data presented differently, drop a comment below and…
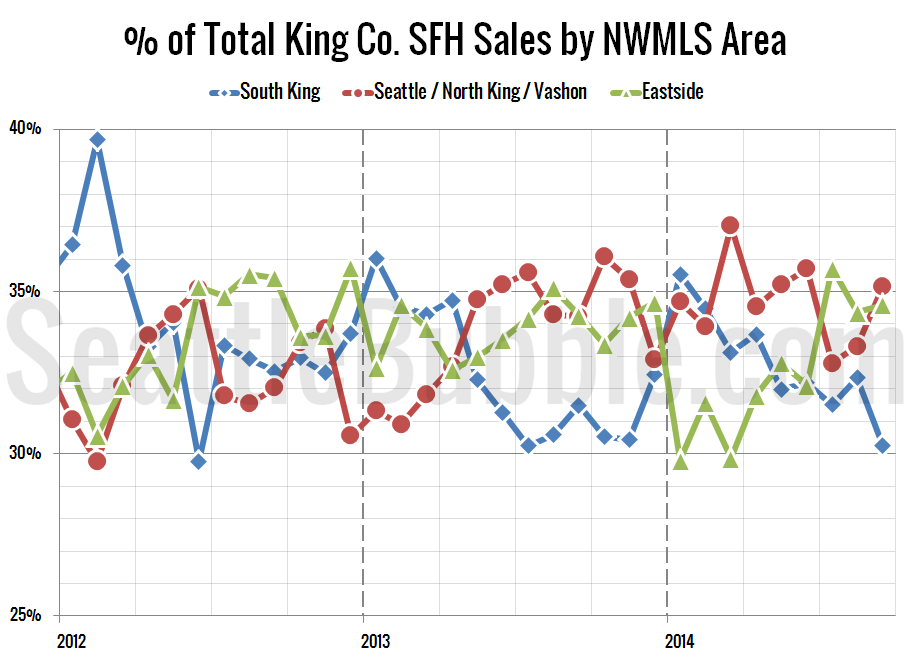
South County Sales Slump in September
Category: Statistics,Neighborhoods Tags: King-geographic-sales,median,NWMLS,REO,Statistics It’s time once again to take an updated look at how King County’s sales are shifting between the different regions around the county, since geographic shifts can and do affect the median price. In order to explore this concept, we break King County down into three regions, based on the NWMLS-defined…
Foreclosures Dipped Again in September
It’s a bit past time for our detailed look at August foreclosure stats in King, Snohomish, and Pierce counties. First up, the Notice of Trustee Sale summary: September 2014 King: 317 NTS, down 44% YOY Snohomish: 182 NTS, down 41% YOY Pierce: 301 NTS, down 29% YOY As usual, the number of trustee sale notices…


