Skip to content

Seattle Bubble

local real estate news, statistics, and commentary without the sales spin.

Menu
  • Home
  • About
  • Contact
  • Reference
  • Speaking
Menu

Category: Statistics

Statistics, number-based analysis, etc.

Case-Shiller: Price Growth Cooled Further in June

Posted on August 26, 2014August 26, 2014 by The Tim

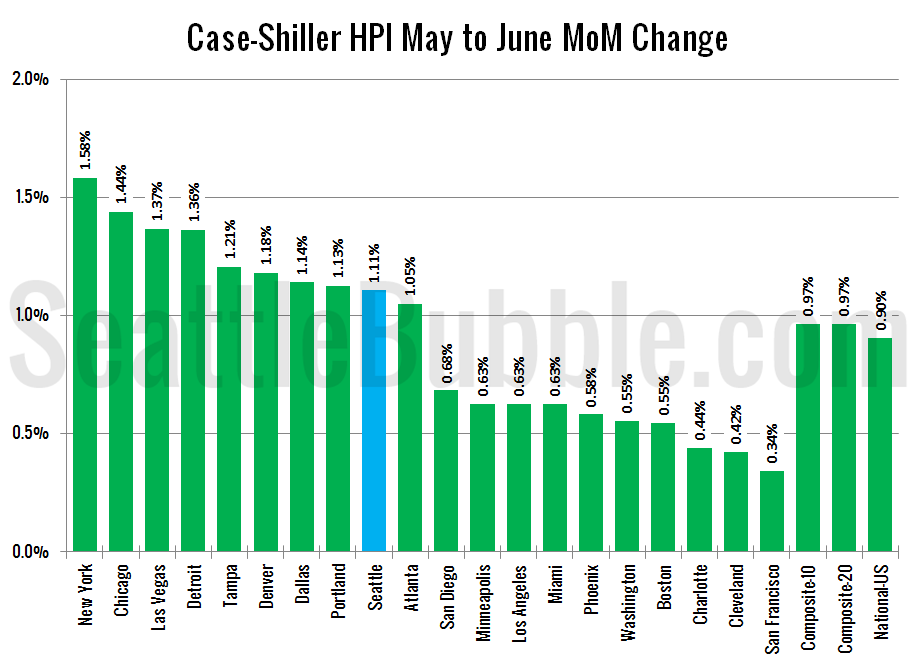
Let’s have a look at the latest data from the Case-Shiller Home Price Index. According to April data, Seattle-area home prices were: Up 1.1% May to June Up 8.6% YOY. Down 11.6% from the July 2007 peak Last year prices rose 1.8% from May to June and year-over-year prices were up 11.8%. The June data…

Share:

  • Twitter
  • LinkedIn
  • Facebook
  • Reddit
  • Pinterest
  • Email

Foreclosures Edged Up In July

Posted on August 21, 2014September 15, 2014 by The Tim

It’s a bit past time for our detailed look at July foreclosure stats in King, Snohomish, and Pierce counties. First up, the Notice of Trustee Sale summary: July 2014 King: 458 NTS, down 16% YOY Snohomish: 174 NTS, down 38% YOY Pierce: 423 NTS, down 1% YOY The number of trustee sale notices continues to…

Share:

  • Twitter
  • LinkedIn
  • Facebook
  • Reddit
  • Pinterest
  • Email

Inventory Growth Continues at a Snail’s Pace

Posted on August 20, 2014August 20, 2014 by The Tim

Let’s take a closer look at how listings fared in July of this year compared to years past. First up, here’s a look at how many new listings hit the market in July, comparing July 2014 to July in every year I’ve got data for. New listings maintained the “six-year high” level they set back…

Share:

  • Twitter
  • LinkedIn
  • Facebook
  • Reddit
  • Pinterest
  • Email

Expensive Eastside Sales Surged in July

Posted on August 19, 2014August 19, 2014 by The Tim

It’s time once again to take an updated look at how King County’s sales are shifting between the different regions around the county, since geographic shifts can and do affect the median price. In order to explore this concept, we break King County down into three regions, based on the NWMLS-defined “areas”: low end: South…

Share:

  • Twitter
  • LinkedIn
  • Facebook
  • Reddit
  • Pinterest
  • Email

Another Bubble? Affordability Only Sustained By Low Rates

Posted on August 14, 2014August 14, 2014 by The Tim

Continuing our “Another Bubble?” series, it’s time to take a look at the affordability index. As King County’s median home price has surged from $405,400 in February to $468,000 in July, the affordability index has dropped from slightly above the long-term average to just below 100. An index level above 100 indicates that the monthly…

Share:

  • Twitter
  • LinkedIn
  • Facebook
  • Reddit
  • Pinterest
  • Email

Posts navigation

  • Previous
  • 1
  • …
  • 52
  • 53
  • 54
  • 55
  • 56
  • 57
  • 58
  • …
  • 222
  • Next

Tim’s Other Projects

Dispatches from the Multiverse

Tip Jar

Like what we're doing?

Drop us a tip!

Accounts

  • Log in
  • Entries feed
  • Comments feed
  • WordPress.org
©2024 Seattle Bubble | Built using WordPress and Responsive Blogily theme by Superb