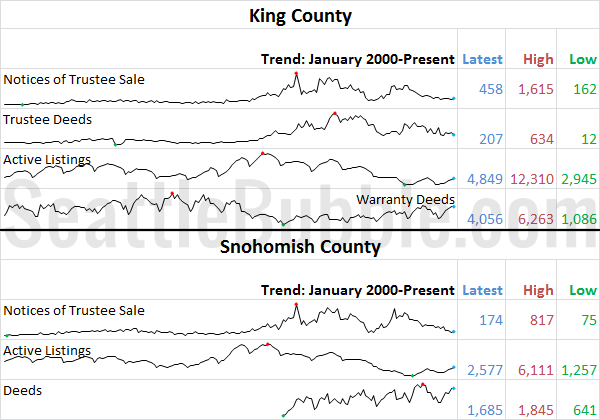
With July 2014 now in the history books, let’s have a look at our monthly stats preview. Most of the charts below are based on broad county-wide data that is available through a simple search of King County and Snohomish County public records. If you have additional stats you’d like to see in the preview,…
Category: Statistics
Statistics, number-based analysis, etc.
Year-Over-Year Price Gains Rapidly Descending to Earth
Let’s take one more look at this week’s Case-Shiller data. Specifically, the rate of change in the year-over-year rate of change, also known as the second derivative. First, let’s take a look at the direction the second derivative is moving in the 20 cities tracked by Case-Shiller. In this chart green dots represent cities with…
Case-Shiller Tiers: Softer May in All Three Tiers
Let’s check out the three price tiers for the Seattle area, as measured by Case-Shiller. Remember, Case-Shiller’s “Seattle” data is based on single-family home repeat sales in King, Pierce, and Snohomish counties. Note that the tiers are determined by sale volume. In other words, 1/3 of all sales fall into each tier. For more details…
Case-Shiller: Home Price Growth Cooled in May
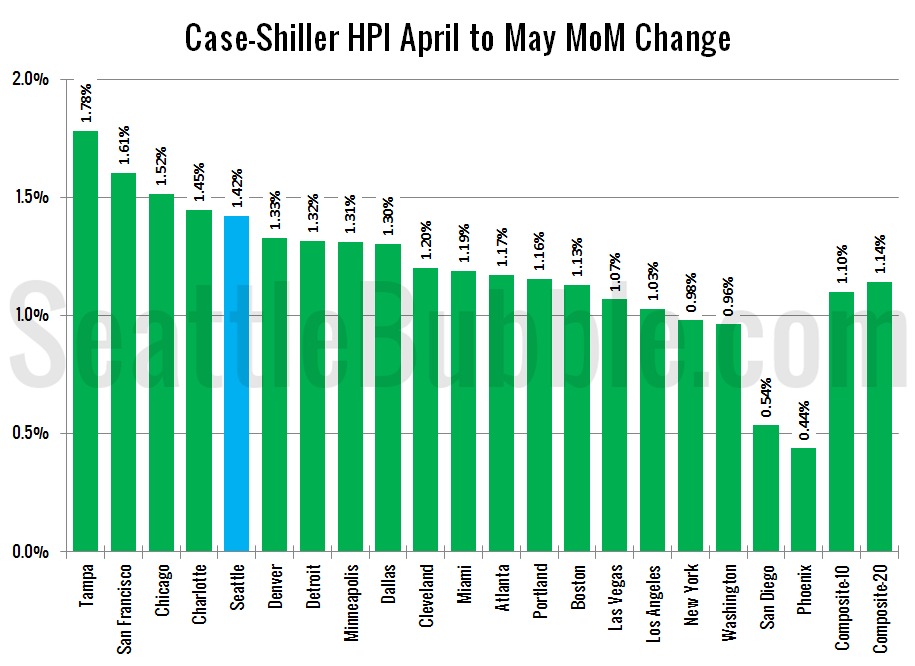
Let’s have a look at the latest data from the Case-Shiller Home Price Index. According to April data, Seattle-area home prices were: Up 1.4% April to May Up 9.3% YOY. Down 12.6% from the July 2007 peak Last year prices rose 3.1% from April to May and year-over-year prices were up 11.9%. Although prices are…
Seattle Unemployment at 6-Year Low in June
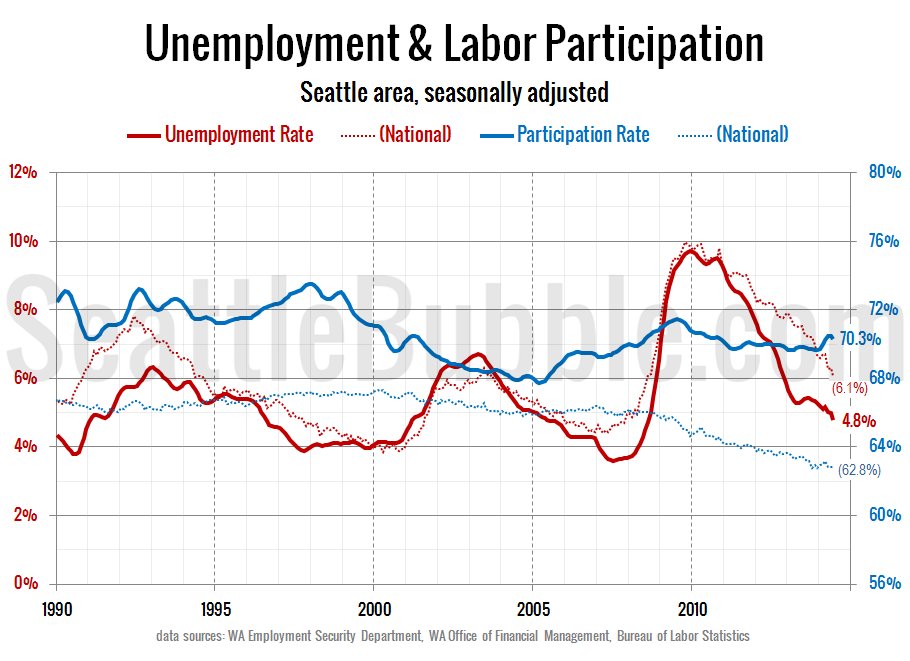
Let’s have a look at the jobs data for June and how the Seattle area’s unemployment rate and approximate labor participation rate alongside the national numbers. In June the Seattle area’s unemployment rate hit its lowest level in almost six years. June’s 4.8 percent unemployment rate was comparable to the 4.7 percent level in August…


