Let’s check in on how Consumer Confidence and mortgage interest rates fared during January. First up, here’s the Consumer Confidence data as of November: At 79.1, the Present Situation Index increased 5% between December and January, and is up 41% from a year earlier. The Present Situation Index is currently up 292% from its December…
Category: Statistics
Statistics, number-based analysis, etc.
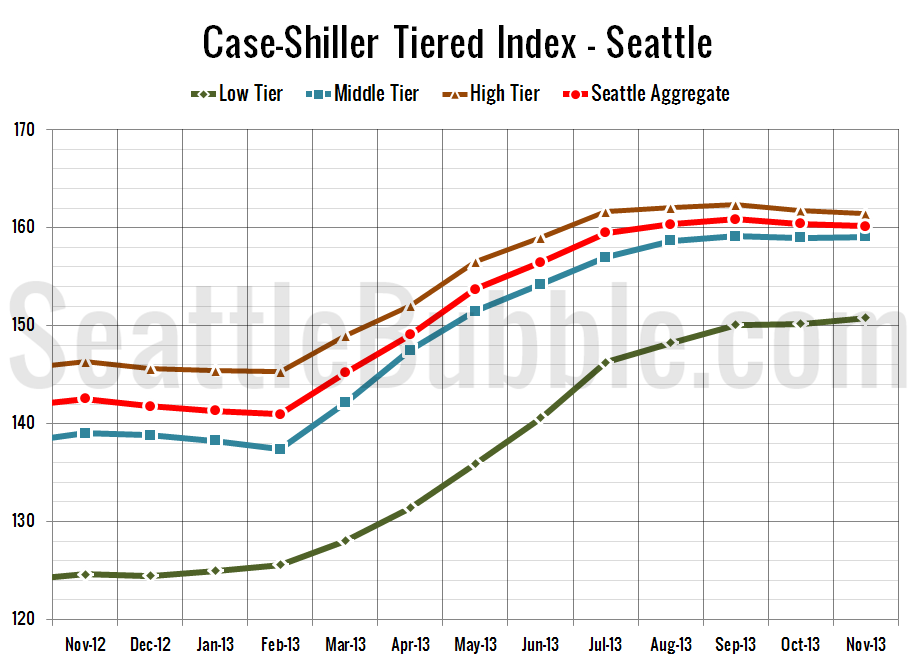
Case-Shiller Tiers: High Tier Slips Alone
Let’s check out the three price tiers for the Seattle area, as measured by Case-Shiller. Remember, Case-Shiller’s “Seattle” data is based on single-family home repeat sales in King, Pierce, and Snohomish counties. Note that the tiers are determined by sale volume. In other words, 1/3 of all sales fall into each tier. For more details…
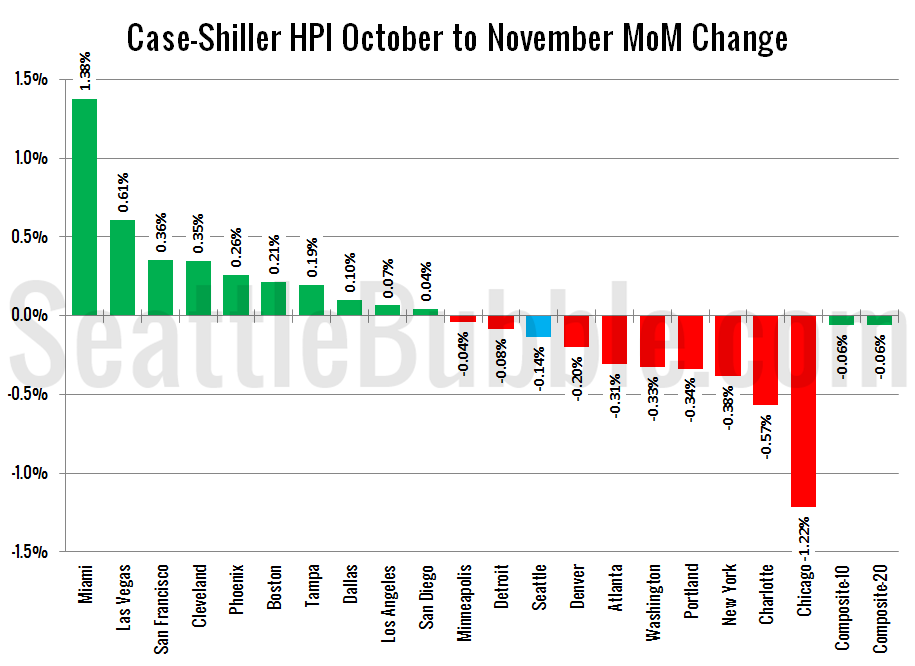
Case-Shiller: Seattle Home Prices Slip in November
Let’s have a look at the latest data from the Case-Shiller Home Price Index. According to November data, Seattle-area home prices were: Down 0.1% October to November Up 12.4% YOY. Down 16.7% from the July 2007 peak Last year prices rose 0.5% from October to November and year-over-year prices were up 7.4%. Home prices in…
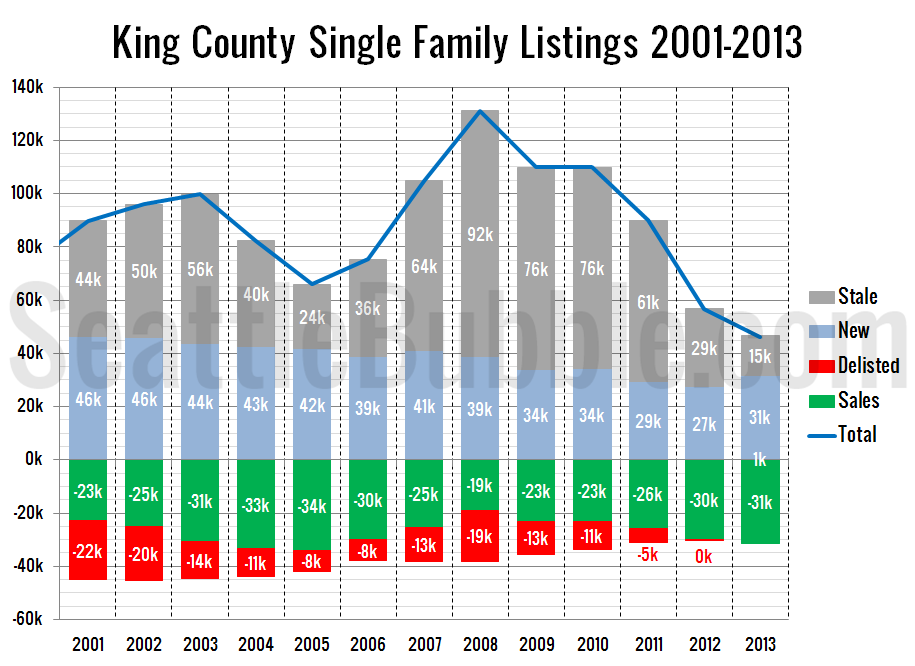
Listing Quantity Improving at 2013 Year’s End
Let’s take a closer look at how listings did over the last few months of 2013 and for the year as a whole. First up, let’s take a look at our yearly summary. In theory the number of homes that are delisted should always show up as a negative number on this chart, but a…
No Surprises as Foreclosures Fell in December
It’s time for our detailed look at December’s foreclosure stats in King, Snohomish, and Pierce counties. First up, the Notice of Trustee Sale summary: December 2013 King: 500 NTS, down 52% YOY Snohomish: 266 NTS, down 56% YOY Pierce: 376 NTS, down 51% YOY The number of trustee sale notices decreased month-over-month again in Snohomish…


