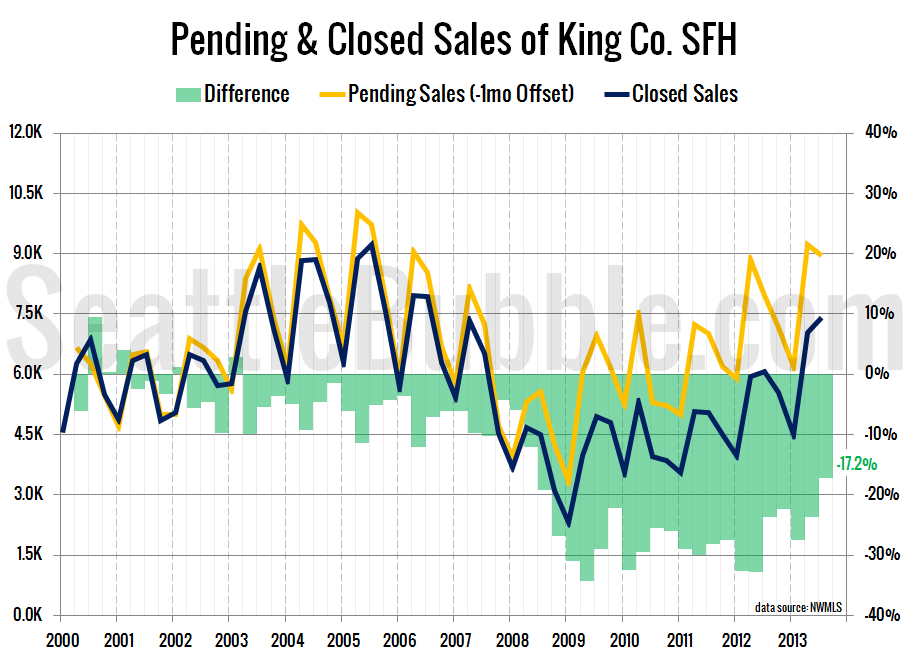
Let’s take a look a the latest data on pending sales volume versus closed sales volume. For this series I roll the pending sales and closed sales data up by quarter, with pending sales offset by one month. In other words, the third quarter numbers below represent pending sales from June, July, and August and…
Category: Statistics
Statistics, number-based analysis, etc.
Foreclosures Mixed in October
It’s time for our detailed look at October ‘s foreclosure stats in King, Snohomish, and Pierce counties. First up, the Notice of Trustee Sale summary: October 2013 King: 520 NTS, down 43% YOY Snohomish: 318 NTS, down 41% YOY Pierce: 464 NTS, down 28% YOY The number of trustee sale notices decreased month-over-month in King…
Listings Begin Typical Seasonal Decline in October
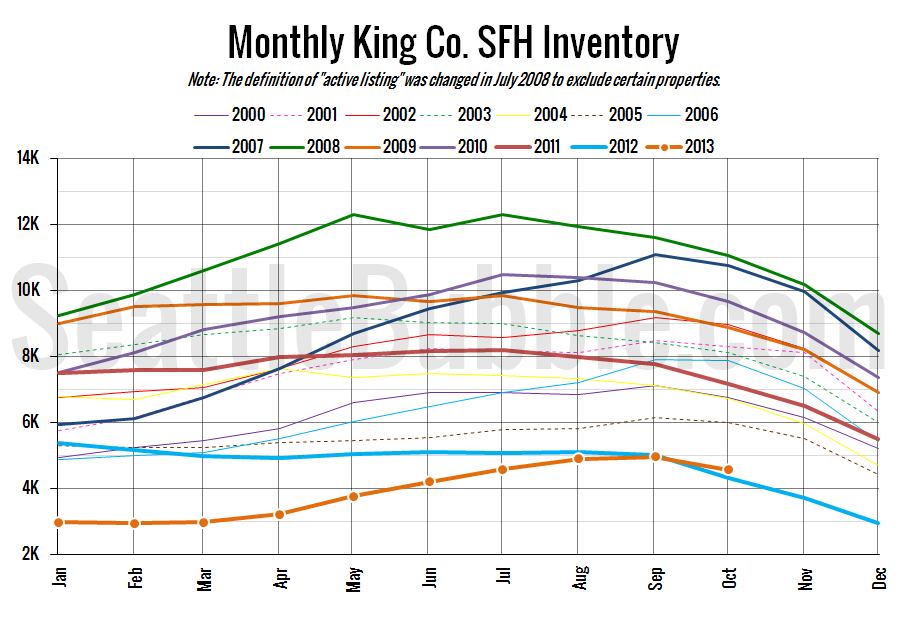
Let’s have a look at how listings are doing over the last few months. First up, here’s a view of how inventory has grown so far this year: 2013 is shaping up to have the fourth-largest one-year growth in inventory on record, behind 2007, 2006, and 2001. Next, the last three months’ worth of new…
October Home Prices Dip Most in Low Tier Neighborhoods
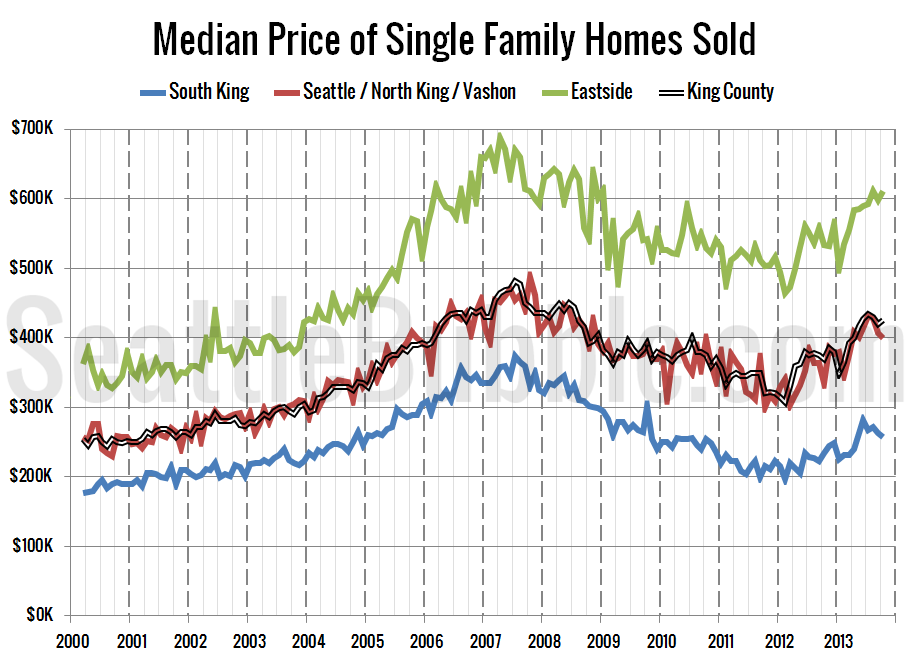
It’s time once again to take an updated look at how King County’s sales are shifting between the different regions around the county, since geographic shifts can and do affect the median price. In order to explore this concept, we break King County down into three regions, based on the NWMLS-defined “areas”: low end: South…
NWMLS: Listings Up From 2012, Pending Sales Down
October market stats are now available from the NWMLS. Here’s a snippet from their press release: Home sales "pause" with government shutdown, but brokers mostly bullish on market recovery. Home sales “paused” during October but prices continued to rise, according to the latest statistics from Northwest Multiple Listing Service. Commenting on year-to-date totals for 2013…


