Skip to content

Seattle Bubble

local real estate news, statistics, and commentary without the sales spin.

Menu
  • Home
  • About
  • Contact
  • Reference
  • Speaking
Menu

Category: Statistics

Statistics, number-based analysis, etc.

Undocumented Shadow Inventory Scarce in King County

Posted on November 5, 2013November 5, 2013 by The Tim

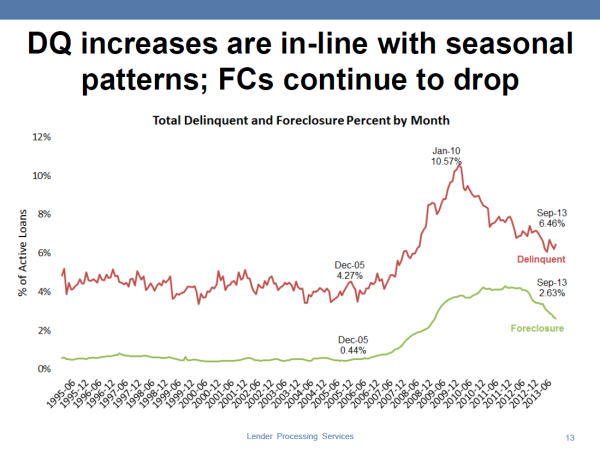
Don’t worry: This will be my last post about the shadow inventory issue for quite some time. In last Friday’s post about shadow inventory, “Haybaler” shared a great link in which Calculated Risk reported LPS delinquency data for September. This data addresses the main complaint some of you have raised about my previous analysis of…

Share:

  • Twitter
  • LinkedIn
  • Facebook
  • Reddit
  • Pinterest
  • Email

October Stats Preview: Inventory Up Year-Over-Year Edition

Posted on November 4, 2013November 4, 2013 by The Tim

With the month of September now in the history books, let’s have a look at our stats preview. Most of the charts below are based on broad county-wide data that is available through a simple search of King County and Snohomish County public records. If you have additional stats you’d like to see in the…

Share:

  • Twitter
  • LinkedIn
  • Facebook
  • Reddit
  • Pinterest
  • Email

“Shadow Inventory” Conspiracy Theories Are Nonsense

Posted on October 31, 2013October 30, 2013 by The Tim

For some reason, a couple weeks ago the Seattle Times website featured a syndicated article about RealtyTrac’s “Vampire REO” nonsense, which in addition to being a completely worthless bit of non-news, was already weeks old when it appeared on the front page of the Seattle Times website. In the comments to the article I did…

Share:

  • Twitter
  • LinkedIn
  • Facebook
  • Reddit
  • Pinterest
  • Email

Case-Shiller Tiers: Low Tier Cooled Most in August

Posted on October 30, 2013October 30, 2013 by The Tim

Let’s check out the three price tiers for the Seattle area, as measured by Case-Shiller. Remember, Case-Shiller’s “Seattle” data is based on single-family home repeat sales in King, Pierce, and Snohomish counties. Note that the tiers are determined by sale volume. In other words, 1/3 of all sales fall into each tier. For more details…

Share:

  • Twitter
  • LinkedIn
  • Facebook
  • Reddit
  • Pinterest
  • Email

Seattle Price Gains Slowest of Case-Shiller Cities in August

Posted on October 29, 2013October 29, 2013 by The Tim

Let’s have a look at the latest data from the Case-Shiller Home Price Index. According to August data, Seattle-area home prices were: Up 0.5% July to August Up 13.2% YOY. Down 16.6% from the July 2007 peak Last year prices fell 0.1% from July to August and year-over-year prices were up 3.4%. Although the month-over-month…

Share:

  • Twitter
  • LinkedIn
  • Facebook
  • Reddit
  • Pinterest
  • Email

Posts navigation

  • Previous
  • 1
  • …
  • 73
  • 74
  • 75
  • 76
  • 77
  • 78
  • 79
  • …
  • 222
  • Next

Tim’s Other Projects

Dispatches from the Multiverse

Tip Jar

Like what we're doing?

Drop us a tip!

Accounts

  • Log in
  • Entries feed
  • Comments feed
  • WordPress.org
©2024 Seattle Bubble | Built using WordPress and Responsive Blogily theme by Superb