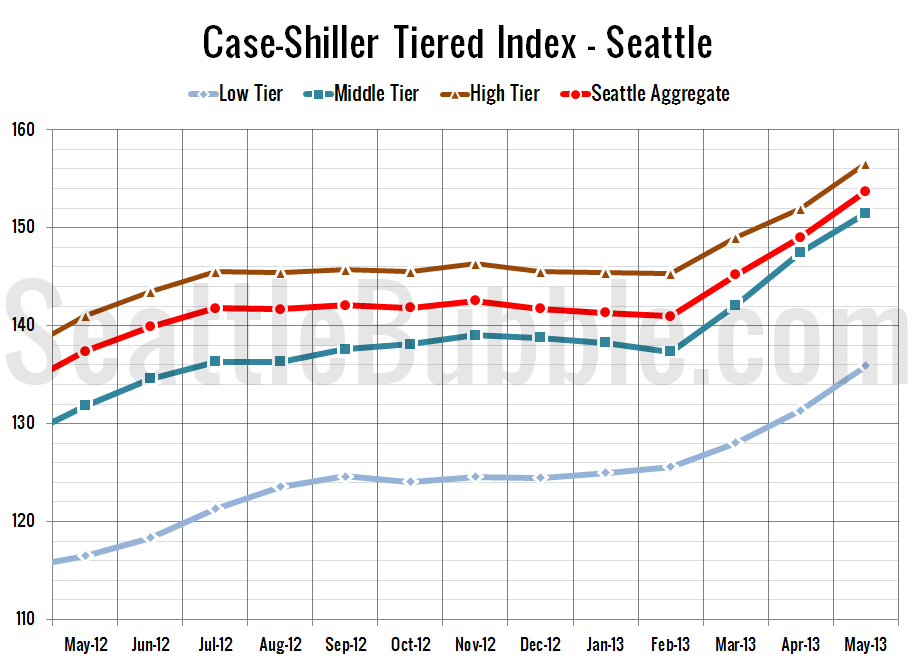
Let’s check out the three price tiers for the Seattle area, as measured by Case-Shiller. Remember, Case-Shiller’s “Seattle” data is based on single-family home repeat sales in King, Pierce, and Snohomish counties. Note that the tiers are determined by sale volume. In other words, 1/3 of all sales fall into each tier. For more details…
Category: Statistics
Statistics, number-based analysis, etc.
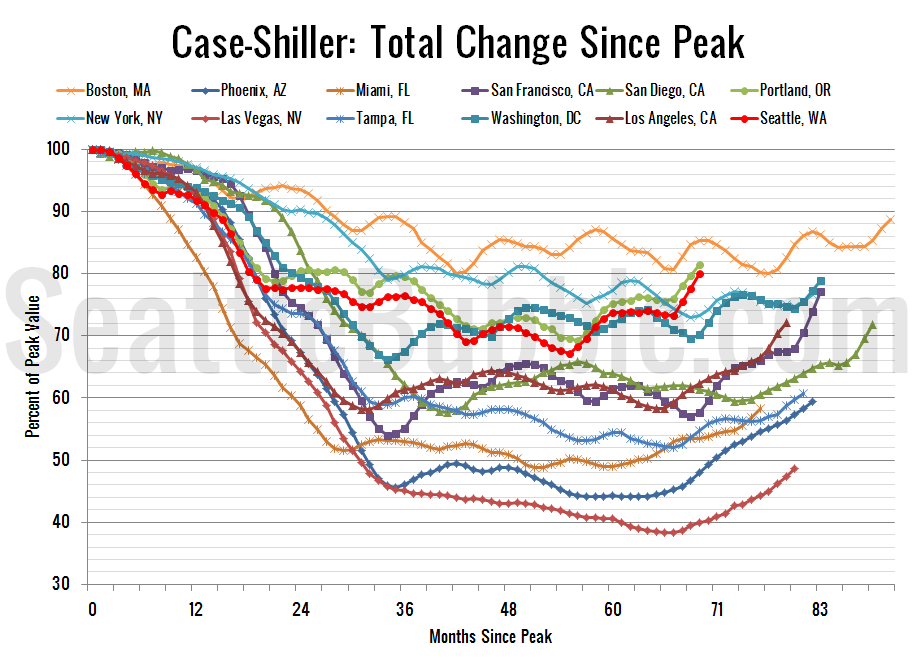
Case-Shiller: Seattle’s Spring Surge Continues
Let’s have a look at the latest data from the Case-Shiller Home Price Index. According to May data, Seattle-area home prices were: Up 3.1% April to May Up 11.9% YOY. Down 20.1% from the July 2007 peak Last year prices rose 2.6% from April to May and year-over-year prices were up 0.6%. Still no surprises,…
New Listings Return to Levels that Outpace Pending Sales
Let’s take one more look at how listings are recovering over the last few months. This first chart shows the difference between the number of new listings each month and the number of pending sales. Prior to late 2011 this number was almost always positive, except in December, when very few new listings hit the…
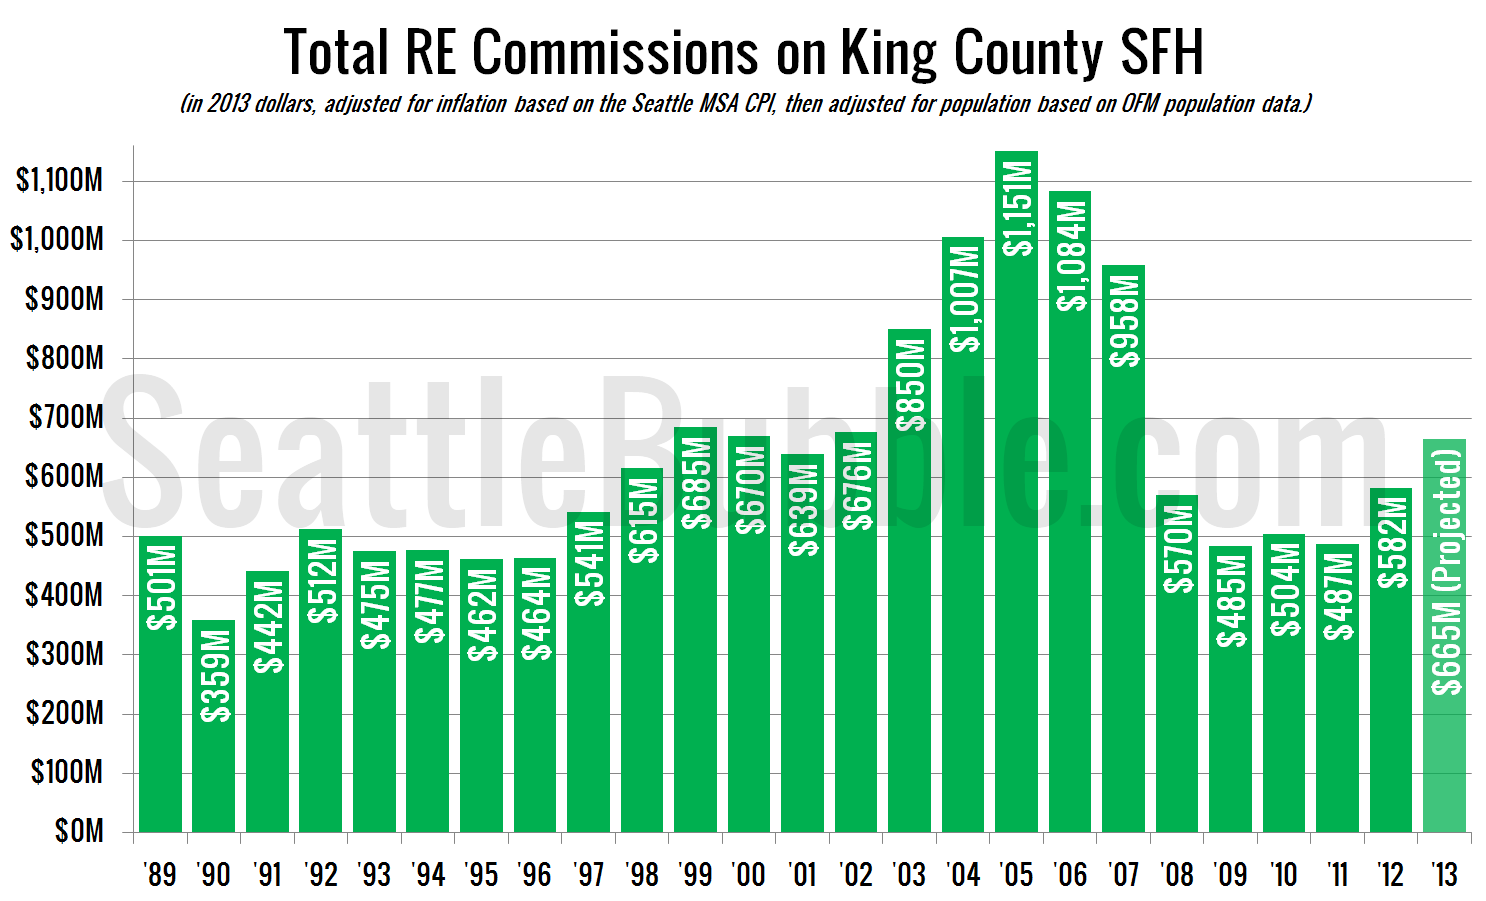
2013 Real Estate Commissions On Par with Pre-Bubble Years
It’s been a year and a half since we looked at how real estate commissions are faring—well past time for an update. For these charts I have estimated the total commissions for 2013 based on the sales volume and prices for the first half of the year. The final numbers will no doubt be slightly…
Seattle Monthly Job Growth Hits 13-Year High in June
New local job stats came out this week, so let’s have a look at the Seattle area’s employment situation. First up, year-over-year job growth, broken down into a few relevant sectors: Since things are getting really jumbled together lately on that chart, I broke down just the last year and zoomed in so you can…


