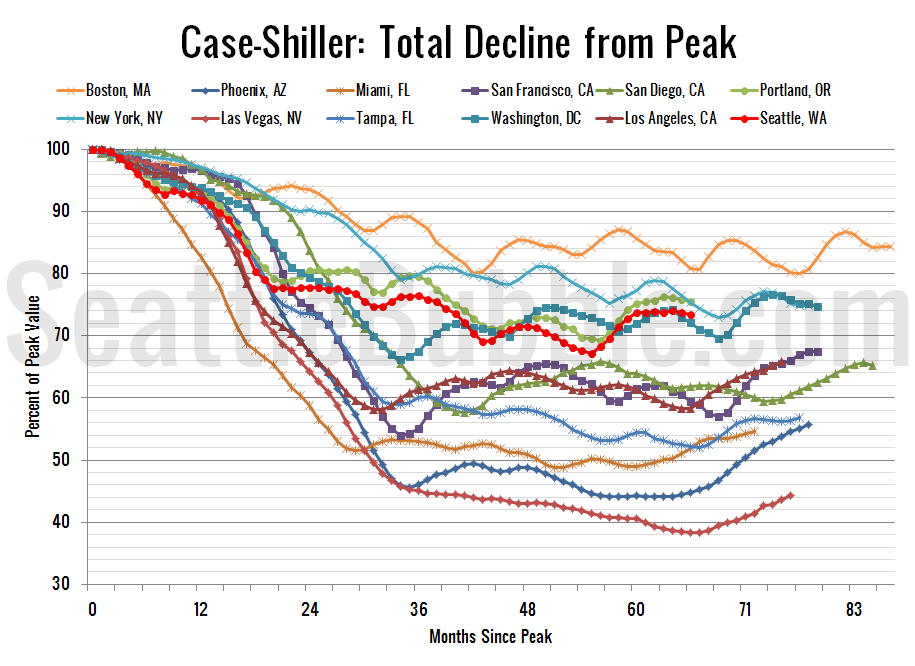
Let’s have a look at the latest data from the Case-Shiller Home Price Index. According to January data, Seattle-area home prices were: Down 0.3% December to January Up 8.7% YOY. Down 26.5% from the July 2007 peak Last year prices fell 0.7% from December to January and year-over-year prices were down 4.0%. Another month without…
Category: Statistics
Statistics, number-based analysis, etc.
Sale Prices Plateau as Listings Keep Tanking
It’s been a while since I posted an update of my charts based on the stats from Redfin’s King County region page, so let’s take a look at those. First up the median list and sale prices per square foot. Note that the list price below includes all homes on the market, whether or not…
Nearly Half of New Listings Pending in Two Weeks
Full disclosure: The Tim is employed by Redfin. Redfin released February housing market data last week, so let’s take a look at the rate at which new listings are going under contract in two weeks or less in the Seattle area, compared to San Francisco and the national rate: I was concerned when this number…
Job Gains Moderate in February as Unemployment Dips
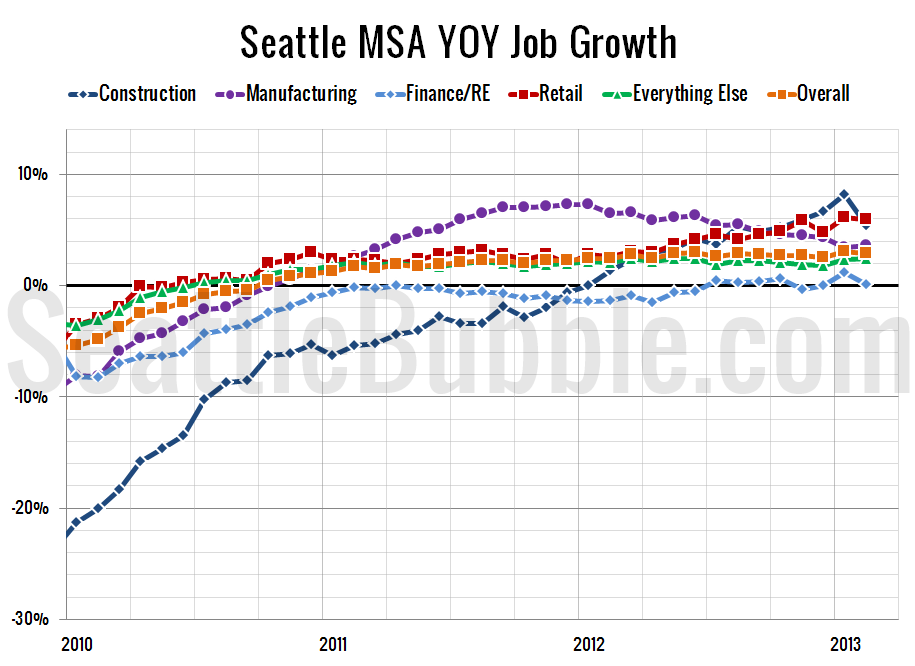
New local job stats came out this week, so let’s have a look at the Seattle area’s employment situation. First up, year-over-year job growth, broken down into a few relevant sectors: Construction growth fell off, dropping from an 8.2% year-over-year gain in January to just 5.4% in February, and the over ten percent gains we…
Sales of $200K-$300K Homes Dipped in February
Let’s have another look at our monthly sales histogram. After sharpening in January, the sales curve flattened out again in February, with home sales between $200,000 and $300,000 taking a hit while home sales between $400,000 and $500,000 bumped up. The mode (i.e. the bucket with the most sales) for non-distressed sales moved from the…


