Skip to content

Seattle Bubble

local real estate news, statistics, and commentary without the sales spin.

Menu
  • Home
  • About
  • Contact
  • Reference
  • Speaking
Menu

Category: Statistics

Statistics, number-based analysis, etc.

Distressed Sales Bump Up Again in February

Posted on March 7, 2013March 8, 2013 by The Tim

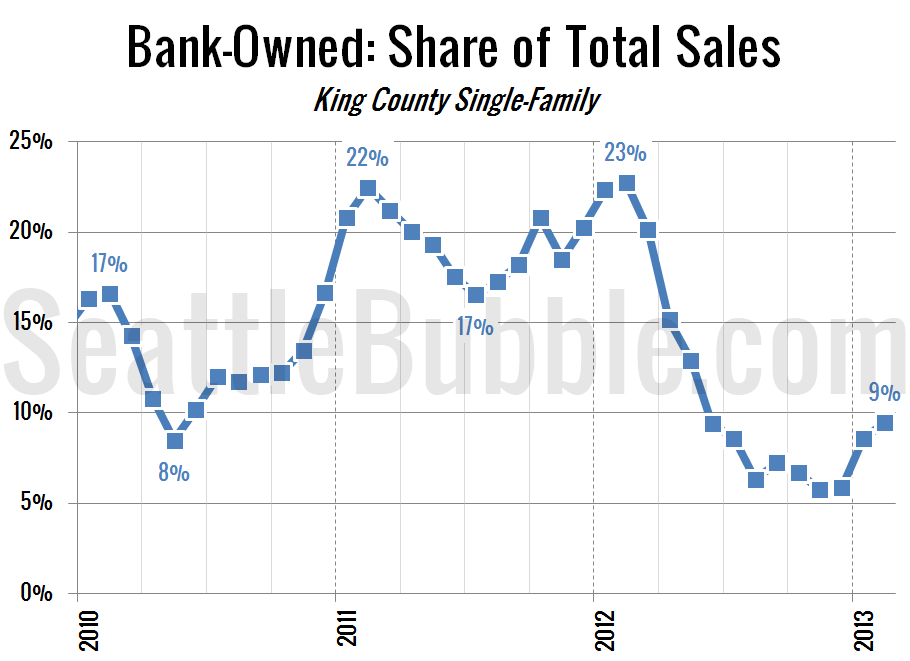
Let’s take another look at what share of the monthly sales are being distressed sales—bank-owned and short sales. In February 2012 22.8% of the sale of single-family homes in King County were bank-owned, the highest level on record. In February 2013 that number was just 9.5%. This represents a slight increase from January, but if…

Share:

  • Twitter
  • LinkedIn
  • Facebook
  • Reddit
  • Pinterest
  • Email

NWMLS: Listings Down Yet Again, Prices Bump Up

Posted on March 5, 2013March 8, 2013 by The Tim

February market stats were published by the NWMLS this morning. Here’s a snippet from their press release: Western Washington housing indicators aligned "for spring market to remember". Real estate brokers around Washington state agree today’s market is far different than two years ago, with one industry veteran summing it up by saying key indicators “are…

Share:

  • Twitter
  • LinkedIn
  • Facebook
  • Reddit
  • Pinterest
  • Email

December 2012 Case-Shiller Potporri

Posted on February 28, 2013September 4, 2013 by The Tim

Before we put away the Case-Shiller data for another month, let’s check in on a few of our alternative charts. First up, let’s take a look at the twenty-city month-over-month scorecard. Here’s the original post introducing this chart if you’d like more details. Click the image below for a super-wide version with the data back…

Share:

  • Twitter
  • LinkedIn
  • Facebook
  • Reddit
  • Pinterest
  • Email

Case-Shiller Tiers: All Three Tiers Dipped in December

Posted on February 27, 2013February 27, 2013 by The Tim

Let’s check out the three price tiers for the Seattle area, as measured by Case-Shiller. Remember, Case-Shiller’s “Seattle” data is based on single-family home repeat sales in King, Pierce, and Snohomish counties. Note that the tiers are determined by sale volume. In other words, 1/3 of all sales fall into each tier. For more details…

Share:

  • Twitter
  • LinkedIn
  • Facebook
  • Reddit
  • Pinterest
  • Email

Case-Shiller: Seattle Home Prices Dip to Close 2012

Posted on February 26, 2013 by The Tim

Let’s have a look at the latest data from the Case-Shiller Home Price Index. According to November data, Seattle-area home prices were: Down 0.5% November to December Up 8.2% YOY. Down 26.3% from the July 2007 peak Last year prices fell 1.3% from November to December and year-over-year prices were down 5.6%. Nothing surprising in…

Share:

  • Twitter
  • LinkedIn
  • Facebook
  • Reddit
  • Pinterest
  • Email

Posts navigation

  • Previous
  • 1
  • …
  • 92
  • 93
  • 94
  • 95
  • 96
  • 97
  • 98
  • …
  • 222
  • Next

Tim’s Other Projects

Dispatches from the Multiverse

Tip Jar

Like what we're doing?

Drop us a tip!

Accounts

  • Log in
  • Entries feed
  • Comments feed
  • WordPress.org
©2024 Seattle Bubble | Built using WordPress and Responsive Blogily theme by Superb
Menu
  • Home
  • About
  • Contact
  • Reference
  • Speaking