Skip to content

Seattle Bubble

local real estate news, statistics, and commentary without the sales spin.

Menu
  • Home
  • About
  • Contact
  • Reference
  • Speaking
Menu

Category: Statistics

Statistics, number-based analysis, etc.

Non-Distressed Median Up 6.5% in December

Posted on January 18, 2013January 18, 2013 by The Tim

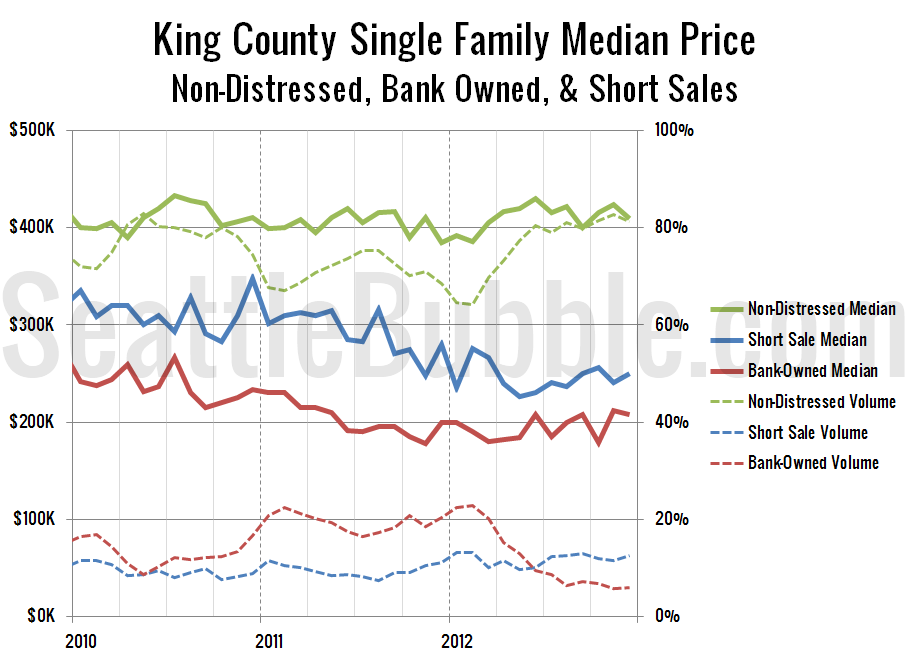
As promised on Wednesday, it’s time to check up on median home sale prices broken down by distress status: Non-distressed, bank-owned, and short sales. As of December, the non-distressed median price for King County single family home sales sits at $409,475, up 6.5% from a year earlier. An increase of 6.5% year-over-year is pretty strong,…

Share:

  • Twitter
  • LinkedIn
  • Facebook
  • Reddit
  • Pinterest
  • Email

Foreclosures Spike Up to Close 2012

Posted on January 17, 2013January 21, 2013 by The Tim

It’s time once again to expand on our preview of foreclosure activity with a more detailed look at December’s stats in King, Snohomish, and Pierce counties. First up, the Notice of Trustee Sale summary: December 2012 King: 1,031 NTS, up 198.8% YOY Snohomish: 609 NTS, up 278.3% YOY Pierce: 770 NTS, up 237.7% YOY All…

Share:

  • Twitter
  • LinkedIn
  • Facebook
  • Reddit
  • Pinterest
  • Email

Bank-Owned Sales Skip Usual Winter Boost

Posted on January 16, 2013January 16, 2013 by The Tim

Let’s take another look at what share of the monthly sales are being taken up by bank-owned and short sales. In December 2011 20.3% of the sale of single-family homes in King County were bank-owned. In December 2012 that number was just 6.0%. I keep thinking this number will go up as more traditional sellers…

Share:

  • Twitter
  • LinkedIn
  • Facebook
  • Reddit
  • Pinterest
  • Email

New Listings Drop 25% From 2012’s Already-Depressed Level

Posted on January 15, 2013January 15, 2013 by The Tim

Well, this is just depressing: After the first two full weeks of the year, new listings of single family homes in King County are down 25% from last year. This follows a 14% drop last year and an 18% drop the year before that. For buyers who were hoping that the new year would bring…

Share:

  • Twitter
  • LinkedIn
  • Facebook
  • Reddit
  • Pinterest
  • Email

Low Rates Keep the “Affordable” Home Price Inflated

Posted on January 14, 2013January 14, 2013 by The Tim

Since we looked at the affordability index last week, Let’s have an updated look at the “affordable home” price chart. In this graph I flip the variables in the affordability index calculation around to other sides of the equation to calculate what price home the median household income could afford to buy at today’s mortgage…

Share:

  • Twitter
  • LinkedIn
  • Facebook
  • Reddit
  • Pinterest
  • Email

Posts navigation

  • Previous
  • 1
  • …
  • 96
  • 97
  • 98
  • 99
  • 100
  • 101
  • 102
  • …
  • 222
  • Next

Tim’s Other Projects

Dispatches from the Multiverse

Tip Jar

Like what we're doing?

Drop us a tip!

Accounts

  • Log in
  • Entries feed
  • Comments feed
  • WordPress.org
©2024 Seattle Bubble | Built using WordPress and Responsive Blogily theme by Superb