Skip to content

Seattle Bubble

local real estate news, statistics, and commentary without the sales spin.

Menu
  • Home
  • About
  • Contact
  • Reference
  • Speaking
Menu

Case-Shiller: Home Price Gains Stall in September

Posted on November 26, 2013November 29, 2013 by The Tim

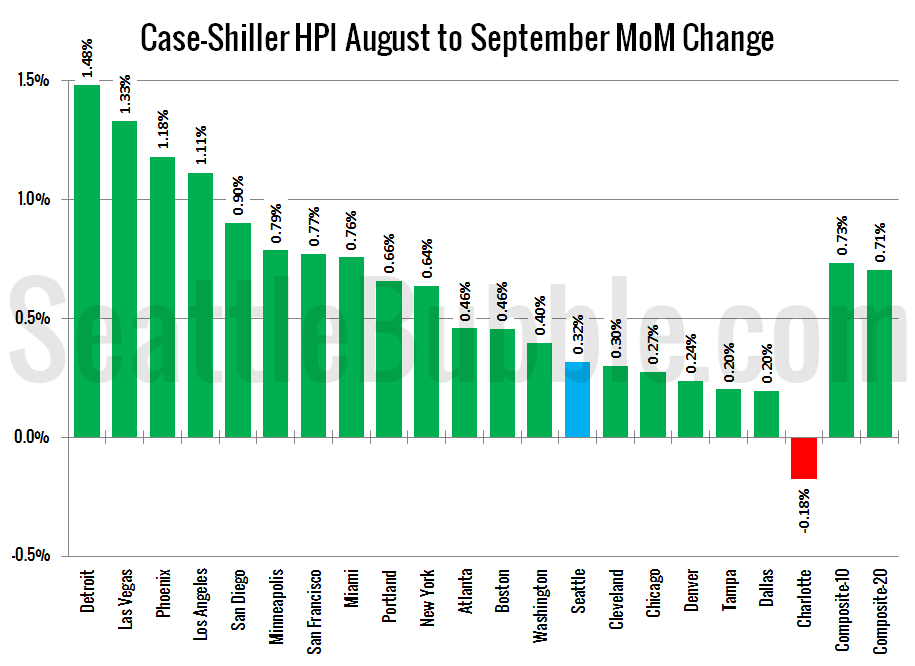
Let’s have a look at the latest data from the Case-Shiller Home Price Index. According to September data, Seattle-area home prices were: Up 0.3% August to September Up 13.2% YOY. Down 16.3% from the July 2007 peak Last year prices rose 0.3% from August to September and year-over-year prices were up 4.8%. Nothing really noteworthy…

Share:

  • Twitter
  • LinkedIn
  • Facebook
  • Reddit
  • Pinterest
  • Email

Local Development Roundup: November 2013

Posted on November 25, 2013 by The Tim

It’s been a while since our first “Local Development Roundup” in which I collect some stories from other local sources about notable development going on in the Seattle area. The content in this month’s post comes courtesy of West Seattle Blog and Capitol Hill Seattle. West Seattle Blog: Neighbors speak out about 36-unit, no-parking Junction…

Share:

  • Twitter
  • LinkedIn
  • Facebook
  • Reddit
  • Pinterest
  • Email

Poll: How much yard do you like?

Posted on November 24, 2013December 1, 2013 by The Tim

This poll was active 11.24.2013 through 11.30.2013

Share:

  • Twitter
  • LinkedIn
  • Facebook
  • Reddit
  • Pinterest
  • Email

Construction Job Growth Slows to a Crawl

Posted on November 22, 2013November 22, 2013 by The Tim

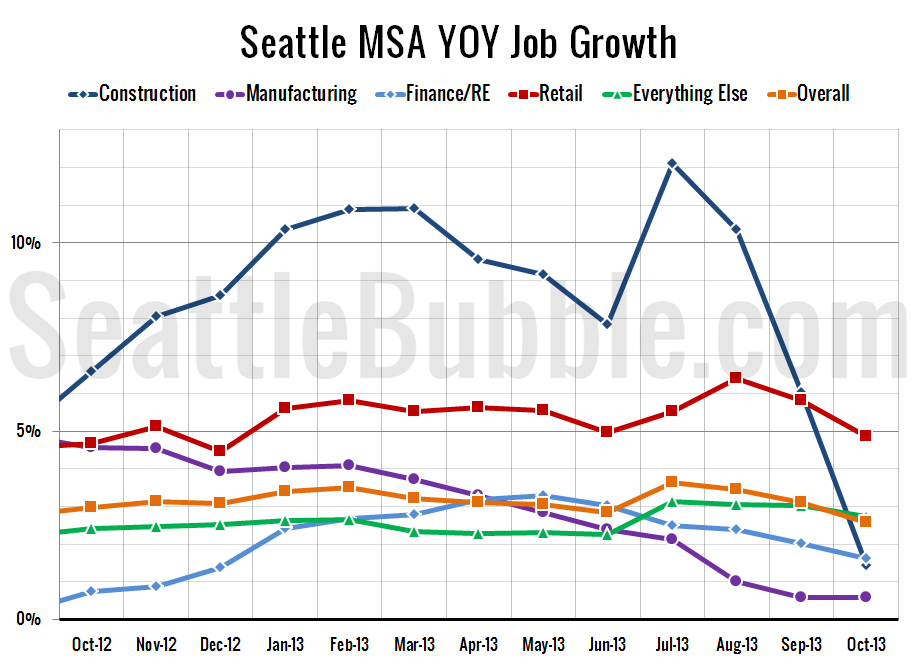
To follow up yesterday’s post on unemployment and labor force participation rate, here’s our breakdown of the job growth (or losses) in specific sectors for the Seattle area. First up, year-over-year job growth, broken down into a few relevant sectors: Here’s a look at just the last year zoomed in so you can see what’s…

Share:

  • Twitter
  • LinkedIn
  • Facebook
  • Reddit
  • Pinterest
  • Email

Seattle Unemployment Increases Four Months in a Row

Posted on November 21, 2013December 20, 2013 by The Tim

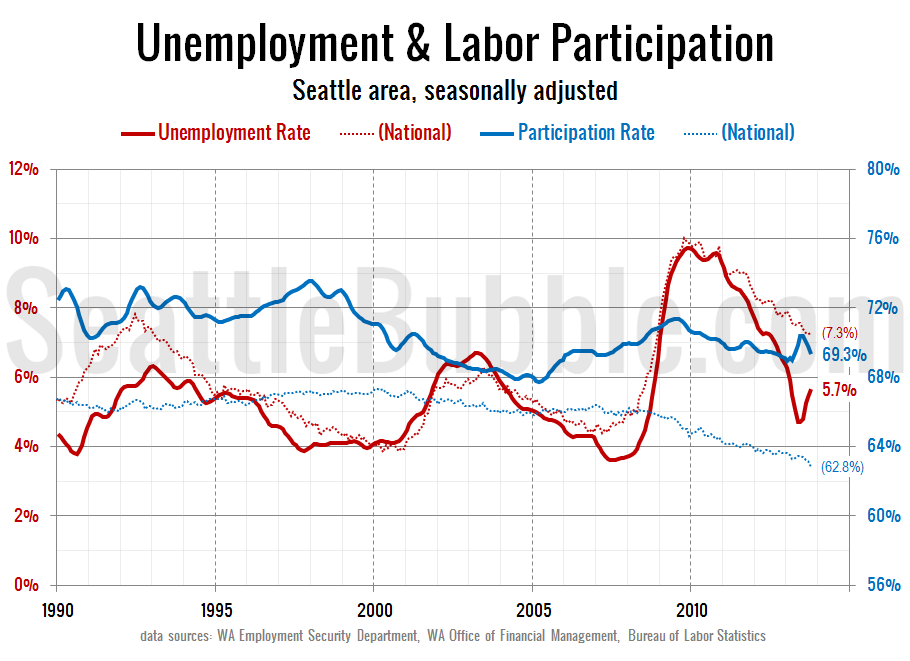
Jobs data for October was released yesterday, so I thought I’d post a chart I’ve been working on that shows the Seattle area’s unemployment rate and approximate labor participation rate alongside the national numbers. As of October, the Seattle area’s unemployment rate has been on a four-month uptick, increasing from 4.7% in May and June…
Share:

  • Twitter
  • LinkedIn
  • Facebook
  • Reddit
  • Pinterest
  • Email

Posts navigation

  • Previous
  • 1
  • …
  • 115
  • 116
  • 117
  • 118
  • 119
  • 120
  • 121
  • …
  • 717
  • Next

Tim’s Other Projects

Dispatches from the Multiverse

Current Market Stats

Charts courtesy Altos Research
Real Estate Market Chart by Altos Research www.altosresearch.com

Real Estate Market Chart by Altos Research www.altosresearch.com

Real Estate Market Chart by Altos Research www.altosresearch.com

Real Estate Market Chart by Altos Research www.altosresearch.com

News Categories

  • News (1,253)
    • Local (223)
    • National (46)
    • International (1)
    • Audio & Video (60)
    • Humor (43)
    • Opinion (88)
    • Uncategorized (314)
  • Features (558)
  • Statistics (1,109)
    • Counties (724)
    • Neighborhoods (100)
  • Economy (74)
  • Extras (491)
    • Polls (381)
    • Flickr Group (1)
    • Announcements (38)
    • Administrative (78)

Archives

Tip Jar

Like what we're doing?

Drop us a tip!

Accounts

  • Log in
  • Entries feed
  • Comments feed
  • WordPress.org
©2024 Seattle Bubble | Built using WordPress and Responsive Blogily theme by Superb