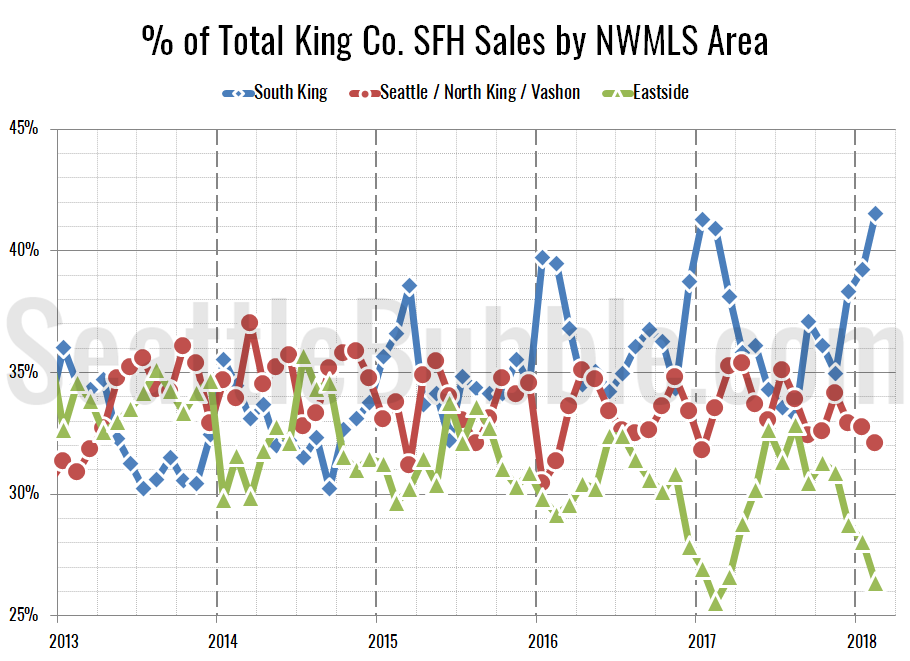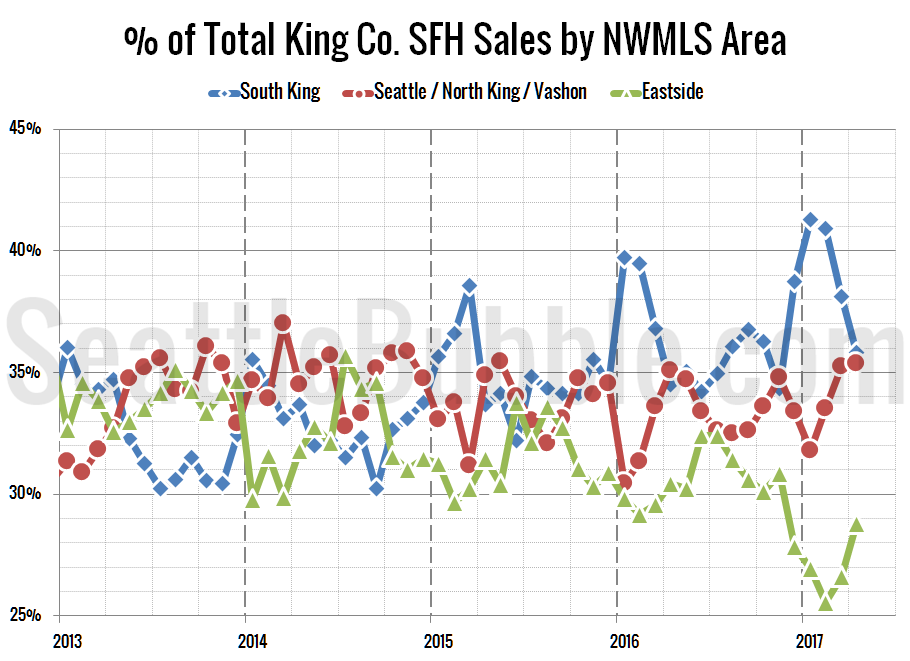
It’s been a few months since we took a look at the in-county breakdown data from the NWMLS to see how the sales mix shifted around the county. I like to keep an eye on this not only to see how individual neighborhoods are doing but also to see how the sales mix shift affects the overall county-wide median price.
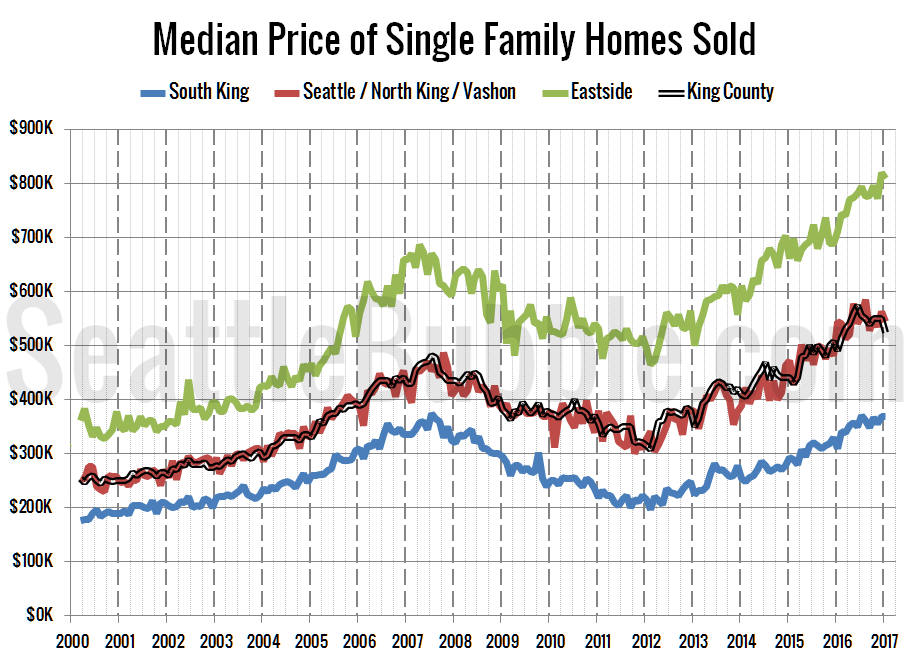
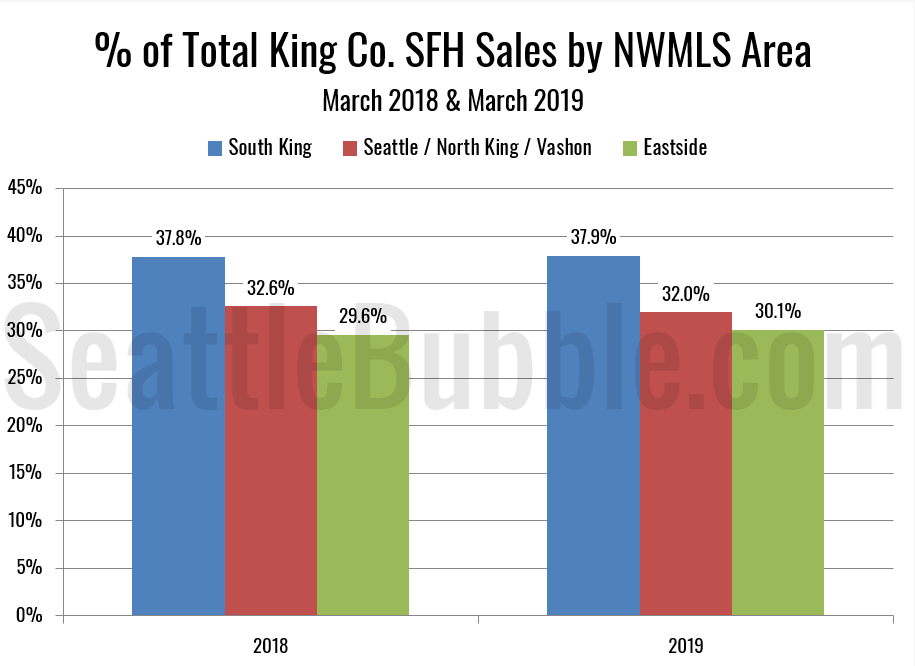
As of March, prices are up from a year ago in the low-end regions, flat in the mid-range regions, and down in the high-end regions. Meanwhile, the share of sales is tilting toward the low-end regions…