Skip to content

Seattle Bubble

local real estate news, statistics, and commentary without the sales spin.

Menu
  • Home
  • About
  • Contact
  • Reference
  • Speaking
Menu

Median Home Prices Inch Above “Affordable Home” Price

Posted on August 20, 2013August 20, 2013 by The Tim

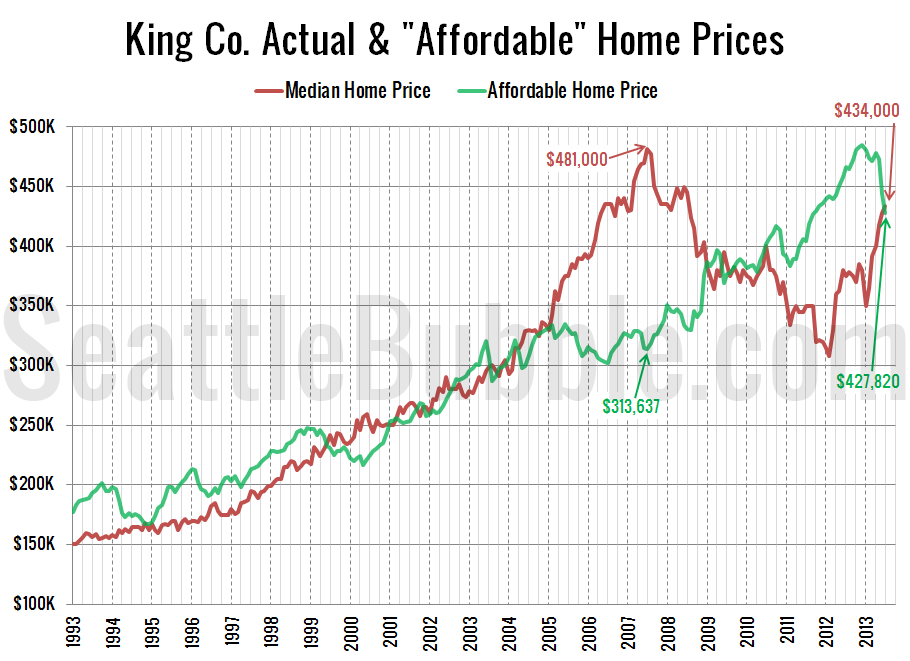
As promised in last week’s affordability post, here’s an updated look at the “affordable home” price chart. In this graph I flip the variables in the affordability index calculation around to other sides of the equation to calculate what price home the a family earning the median household income could afford to buy at today’s…

Share:

  • Twitter
  • LinkedIn
  • Facebook
  • Reddit
  • Pinterest
  • Email

FHA: Foreclosure One Year Ago? No Problem!

Posted on August 19, 2013 by The Tim

I received tips from two different people in the last few days about a recent change in FHA underwriting standards announced in a letter titled “Back to Work – Extenuating Circumstances” Quoting from the letter: As a result of the recent recession many borrowers who experienced unemployment or other severe reductions in income, were unable…

Share:

  • Twitter
  • LinkedIn
  • Facebook
  • Reddit
  • Pinterest
  • Email

Poll: Small & perfect or big & needs work?

Posted on August 18, 2013August 25, 2013 by The Tim

This poll was active 08.18.2013 through 08.24.2013

Share:

  • Twitter
  • LinkedIn
  • Facebook
  • Reddit
  • Pinterest
  • Email

Affordability Index Falls Below 100, Hits 4-Year Low

Posted on August 16, 2013October 23, 2013 by The Tim

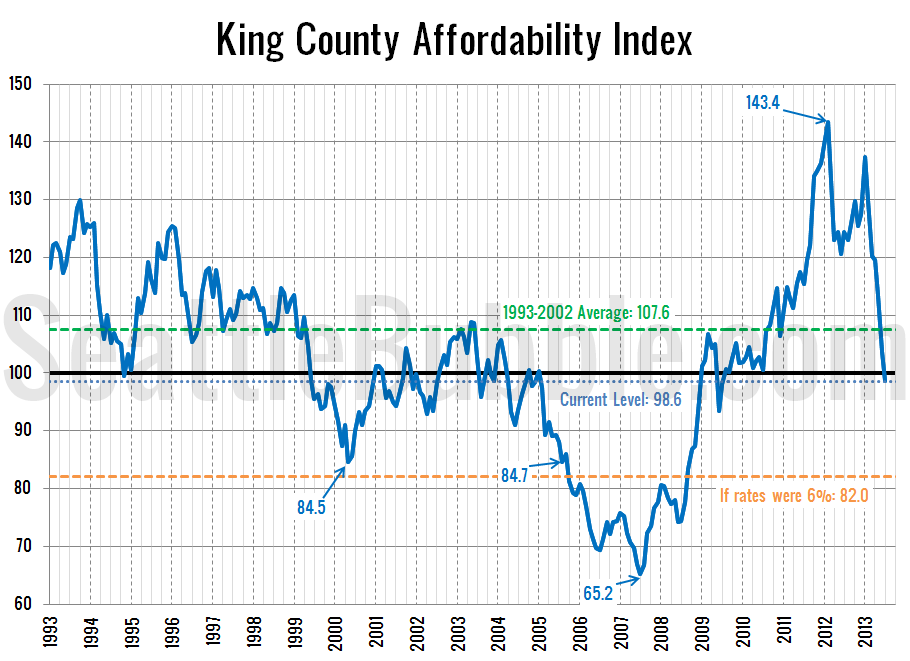
As volatile as interest rates and home prices have both been this year, I thought it would be good to make the affordability index more of a regular post. So how does affordability look as of July? Not great. The index fell below 100 (i.e. the median-priced home is affordable to a median-income household) for…

Share:

  • Twitter
  • LinkedIn
  • Facebook
  • Reddit
  • Pinterest
  • Email

Foreclosures Keep Falling in King, Pierce & Snohomish

Posted on August 15, 2013August 15, 2013 by The Tim

It’s time for our detailed look at July’s foreclosure stats in King, Snohomish, and Pierce counties. First up, the Notice of Trustee Sale summary: July 2013 King: 548 NTS, down 44% YOY Snohomish: 282 NTS, down 40% YOY Pierce: 429 NTS, down 16% YOY For the first time since June of last year, all three…
Share:

  • Twitter
  • LinkedIn
  • Facebook
  • Reddit
  • Pinterest
  • Email

Posts navigation

  • Previous
  • 1
  • …
  • 130
  • 131
  • 132
  • 133
  • 134
  • 135
  • 136
  • …
  • 717
  • Next

Tim’s Other Projects

Dispatches from the Multiverse

Current Market Stats

Charts courtesy Altos Research
Real Estate Market Chart by Altos Research www.altosresearch.com

Real Estate Market Chart by Altos Research www.altosresearch.com

Real Estate Market Chart by Altos Research www.altosresearch.com

Real Estate Market Chart by Altos Research www.altosresearch.com

News Categories

  • News (1,253)
    • Local (223)
    • National (46)
    • International (1)
    • Audio & Video (60)
    • Humor (43)
    • Opinion (88)
    • Uncategorized (314)
  • Features (558)
  • Statistics (1,109)
    • Counties (724)
    • Neighborhoods (100)
  • Economy (74)
  • Extras (491)
    • Polls (381)
    • Flickr Group (1)
    • Announcements (38)
    • Administrative (78)

Archives

Tip Jar

Like what we're doing?

Drop us a tip!

Accounts

  • Log in
  • Entries feed
  • Comments feed
  • WordPress.org
©2024 Seattle Bubble | Built using WordPress and Responsive Blogily theme by Superb
Menu
  • Home
  • About
  • Contact
  • Reference
  • Speaking