Skip to content

Seattle Bubble

local real estate news, statistics, and commentary without the sales spin.

Menu
  • Home
  • About
  • Contact
  • Reference
  • Speaking
Menu

July Reporting Roundup: “Cyclone of Sales” Edition

Posted on August 7, 2013August 7, 2013 by The Tim

It’s time once again for the monthly reporting roundup, where you can read my wry commentary about the news instead of subjecting yourself to boring rehashes of the NWMLS press release (or in addition to, if that’s what floats your boat). To kick things off, here’s an excerpt from the NWMLS press release: Home sales,…

Share:

  • Twitter
  • LinkedIn
  • Facebook
  • Reddit
  • Pinterest
  • Email

NWMLS: Inventory Increases Again, Pending Sales Fall

Posted on August 6, 2013August 7, 2013 by The Tim

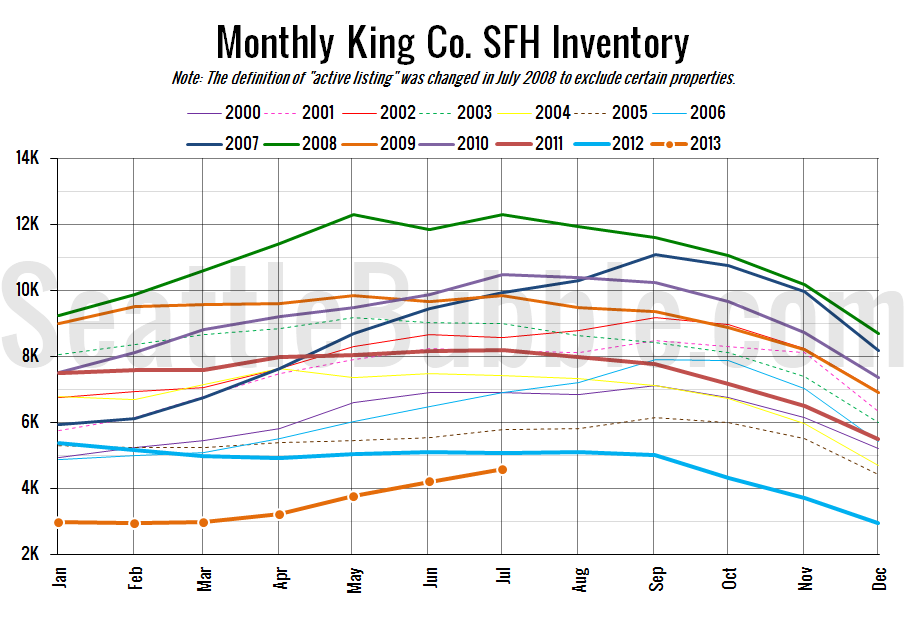
July market stats were published by the NWMLS this morning. Here’s a snippet from their press release: Home sales, prices still rising in Western Washington despite lean inventory and increasing mortgage rates. Rising interest rates, rising prices and rising consumer confidence are creating a “positive cyclone of home sales activity,” according to members of the…

Share:

  • Twitter
  • LinkedIn
  • Facebook
  • Reddit
  • Pinterest
  • Email

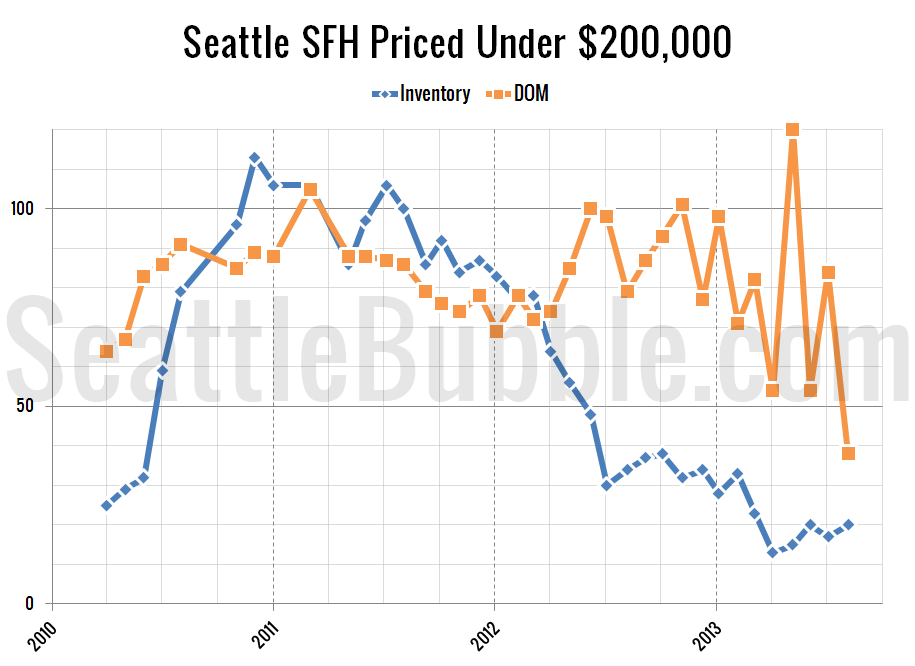
Cheapest Homes: August 2013 Edition

Posted on August 5, 2013August 5, 2013 by The Tim

Let’s check in again on the cheapest homes around Seattle proper. Here’s our methodology: I search the listings for the cheapest homes currently on the market, excluding short sales, in the city of Seattle proper. Any properties that are in obvious states of extreme disrepair based on listing photos and descriptions will be excluded. This…

Share:

  • Twitter
  • LinkedIn
  • Facebook
  • Reddit
  • Pinterest
  • Email

Poll: Who was the best president in the last 30 years?

Posted on August 4, 2013August 11, 2013 by The Tim

This poll was active 08.04.2013 through 08.10.2013

Share:

  • Twitter
  • LinkedIn
  • Facebook
  • Reddit
  • Pinterest
  • Email

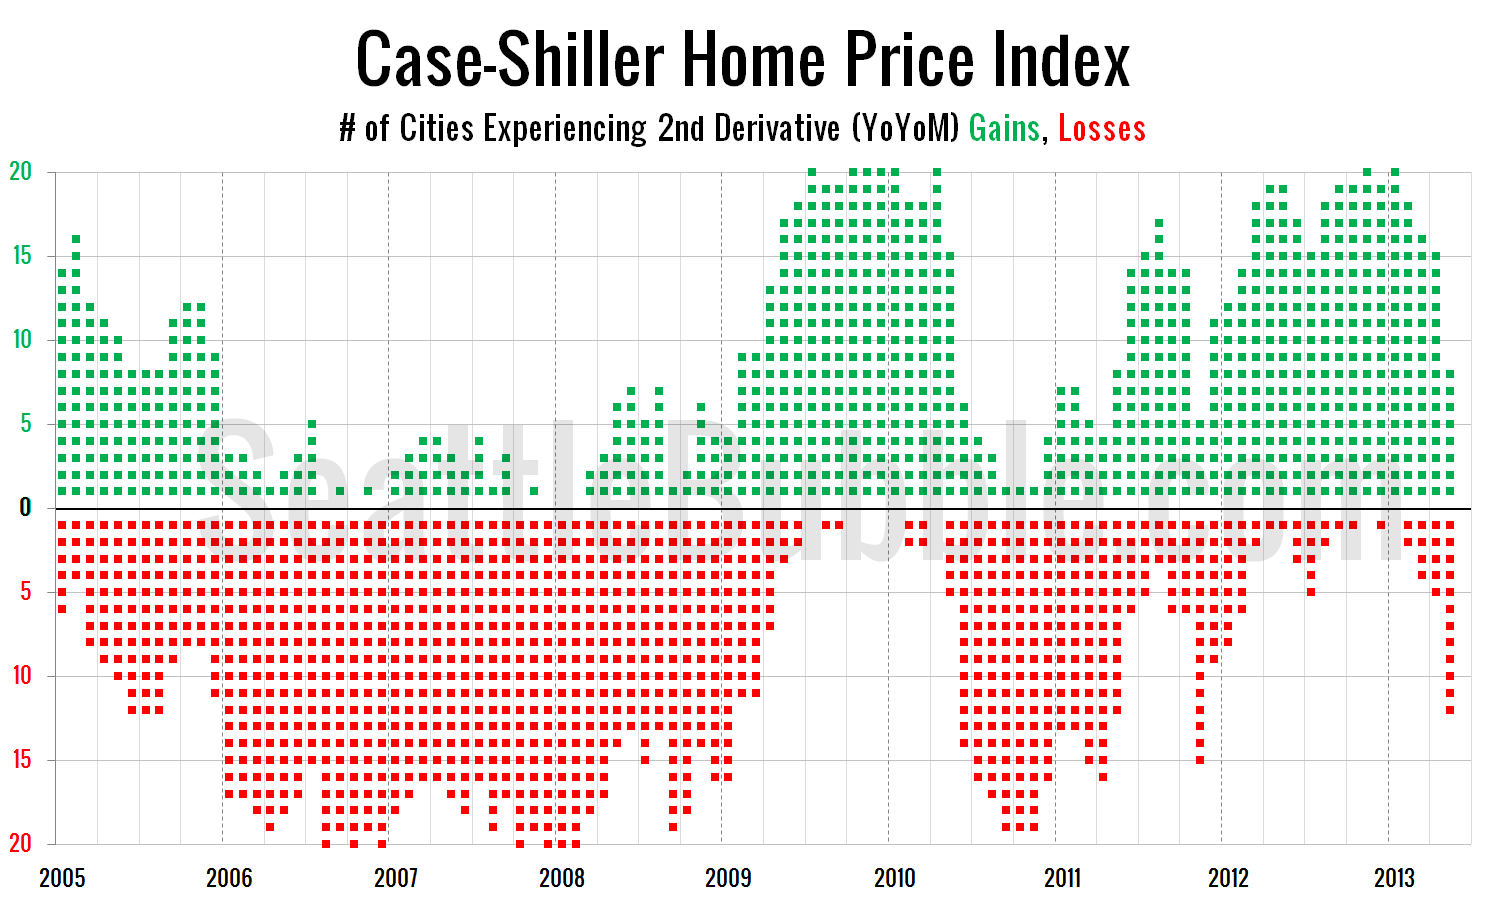
Case-Shiller: Second Derivative Gains Rapidly Evaporating

Posted on August 2, 2013September 4, 2013 by The Tim

Before we put away the May Case-Shiller data, let’s have a look at my favorite alternative Case-Shiller charts. First up, let’s take a look at the twenty-city month-over-month scorecard. Here’s the original post introducing this chart if you’d like more details. Click the image below for a super-wide version with the data back through 2000….

Share:

  • Twitter
  • LinkedIn
  • Facebook
  • Reddit
  • Pinterest
  • Email

Posts navigation

  • Previous
  • 1
  • …
  • 132
  • 133
  • 134
  • 135
  • 136
  • 137
  • 138
  • …
  • 717
  • Next

Tim’s Other Projects

Dispatches from the Multiverse

Current Market Stats

Charts courtesy Altos Research
Real Estate Market Chart by Altos Research www.altosresearch.com

Real Estate Market Chart by Altos Research www.altosresearch.com

Real Estate Market Chart by Altos Research www.altosresearch.com

Real Estate Market Chart by Altos Research www.altosresearch.com

News Categories

  • News (1,253)
    • Local (223)
    • National (46)
    • International (1)
    • Audio & Video (60)
    • Humor (43)
    • Opinion (88)
    • Uncategorized (314)
  • Features (558)
  • Statistics (1,109)
    • Counties (724)
    • Neighborhoods (100)
  • Economy (74)
  • Extras (491)
    • Polls (381)
    • Flickr Group (1)
    • Announcements (38)
    • Administrative (78)

Archives

Tip Jar

Like what we're doing?

Drop us a tip!

Accounts

  • Log in
  • Entries feed
  • Comments feed
  • WordPress.org
©2024 Seattle Bubble | Built using WordPress and Responsive Blogily theme by Superb