This poll was active 08.04.2013 through 08.10.2013
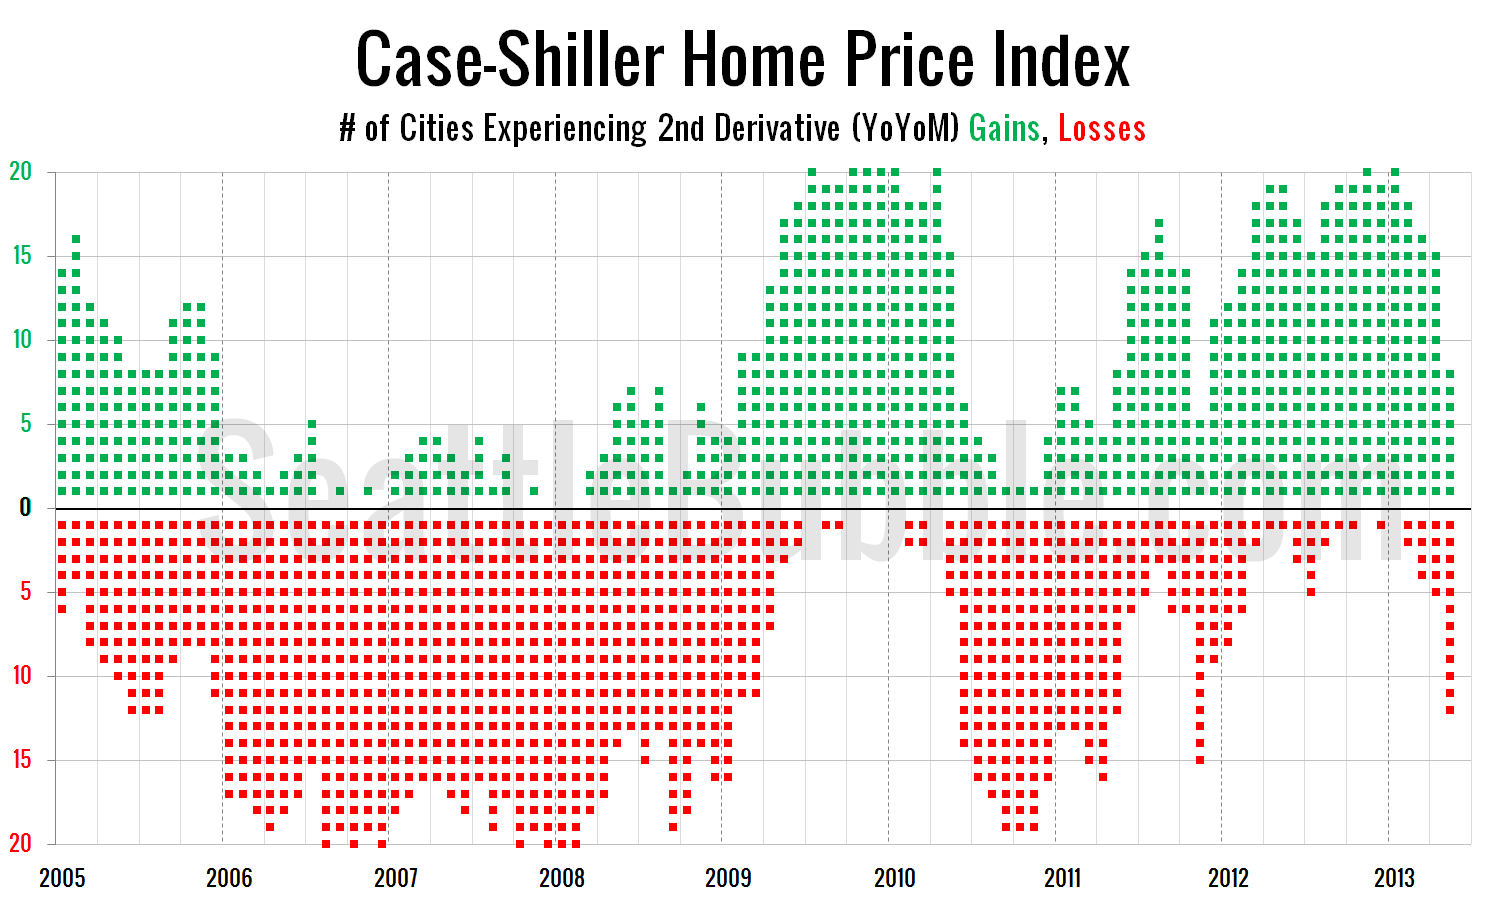
Case-Shiller: Second Derivative Gains Rapidly Evaporating
Before we put away the May Case-Shiller data, let’s have a look at my favorite alternative Case-Shiller charts. First up, let’s take a look at the twenty-city month-over-month scorecard. Here’s the original post introducing this chart if you’d like more details. Click the image below for a super-wide version with the data back through 2000….
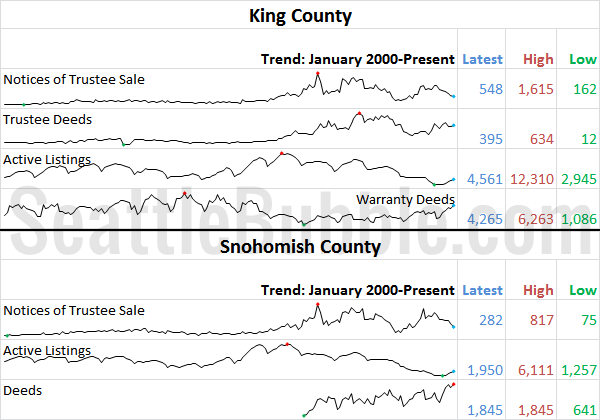
July Stats Preview: Ongoing Inventory Recovery Edition
Now that the month of July is behind us, let’s have a look at our stats preview. Most of the charts below are based on broad county-wide data that is available through a simple search of King County and Snohomish County public records. If you have additional stats you’d like to see in the preview,…
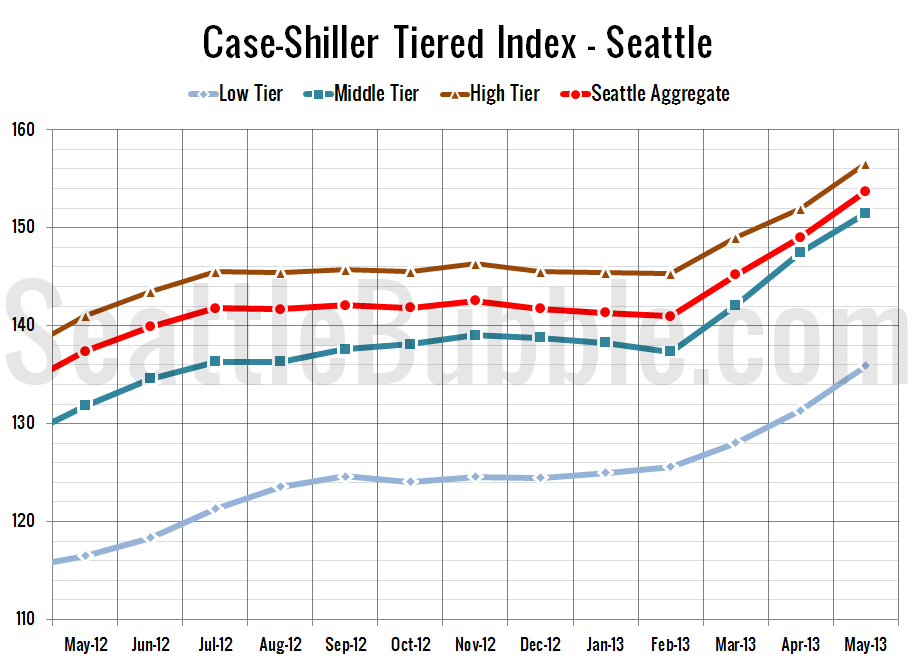
Case-Shiller Tiers: Low Tier Surged Most in May
Let’s check out the three price tiers for the Seattle area, as measured by Case-Shiller. Remember, Case-Shiller’s “Seattle” data is based on single-family home repeat sales in King, Pierce, and Snohomish counties. Note that the tiers are determined by sale volume. In other words, 1/3 of all sales fall into each tier. For more details…
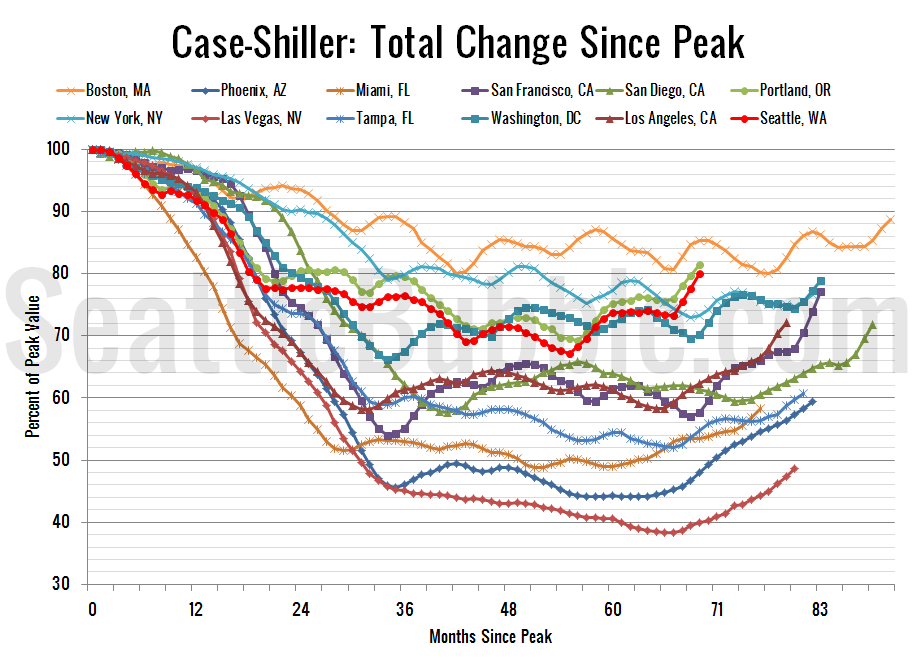
Case-Shiller: Seattle’s Spring Surge Continues
Let’s have a look at the latest data from the Case-Shiller Home Price Index. According to May data, Seattle-area home prices were: Up 3.1% April to May Up 11.9% YOY. Down 20.1% from the July 2007 peak Last year prices rose 2.6% from April to May and year-over-year prices were up 0.6%. Still no surprises,…