Skip to content

Seattle Bubble

local real estate news, statistics, and commentary without the sales spin.

Menu
  • Home
  • About
  • Contact
  • Reference
  • Speaking
Menu

All Sale Price Tiers Bumped Up in March

Posted on April 22, 2013April 22, 2013 by The Tim

Let’s have another look at our monthly sales histogram. Sales across all price tiers got a big boost in March, while the sales curve stayed basically the same shape as February. The mode (i.e. the bucket with the most sales) for non-distressed sales moved from the $400,000 to $450,000 bucket in February down to the…

Share:

  • Twitter
  • LinkedIn
  • Facebook
  • Reddit
  • Pinterest
  • Email

Poll: Neighborhood Smackdown: Greenlake vs. U District

Posted on April 21, 2013April 28, 2013 by The Tim

This poll was active 04.21.2013 through 04.27.2013

Share:

  • Twitter
  • LinkedIn
  • Facebook
  • Reddit
  • Pinterest
  • Email

Weekly Twitter Digest (Link Roundup) for 2013-04-19

Posted on April 20, 2013 by The Tim

"Financiers worry Seattle’s apartment boom is overdone" http://t.co/463RRbQgsN via @SeattleTimes -> "Over the long haul, the economy grows when people invest in things other than housing." http://t.co/KgOnC2unkx via @WSJ -> "'Apodment' living isn't for Snohomish, council says" http://t.co/EwMmy29UiF via @EverettHerald ->

Share:

  • Twitter
  • LinkedIn
  • Facebook
  • Reddit
  • Pinterest
  • Email

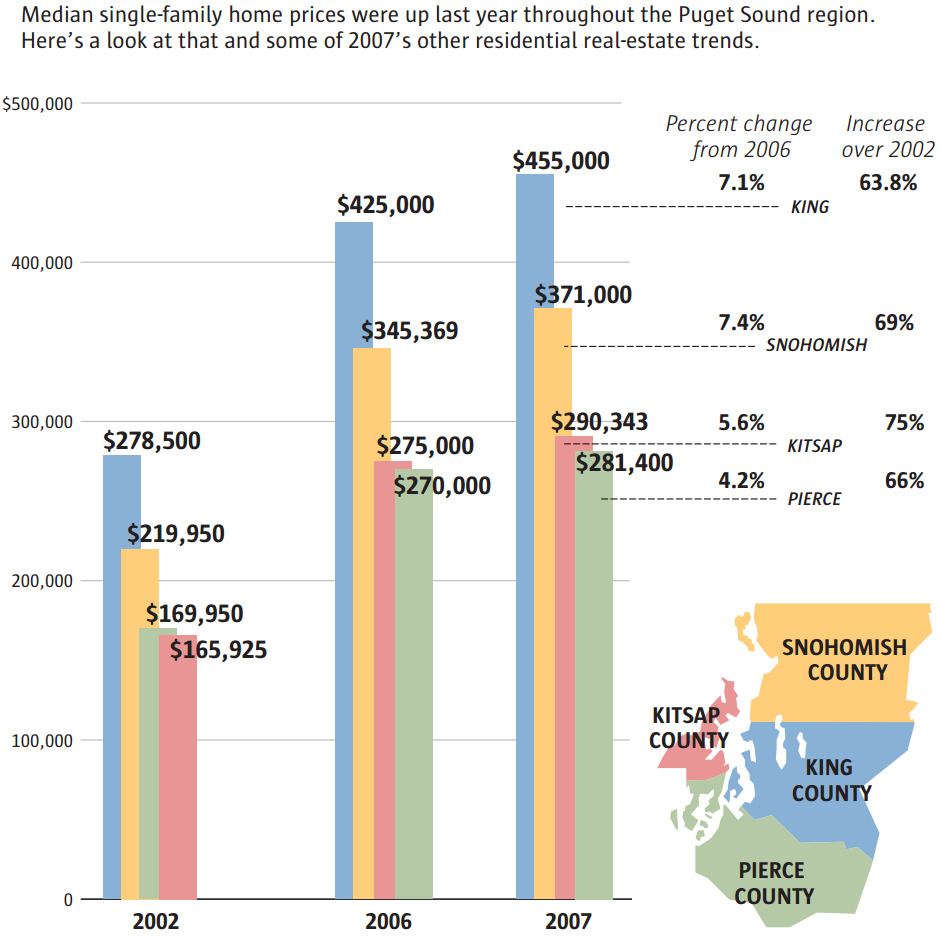
Friday Flashback: “Prices more than held their own.”

Posted on April 19, 2013April 19, 2013 by The Tim

Six months after home prices in the Seattle area began declining from their July 2007 peak, the annual report from the NWMLS led to a series of amusingly rosy stories in the local press in early 2008. Here’s a typical example from the Seattle Times: ’07 home prices not so bad after all With all…

Share:

  • Twitter
  • LinkedIn
  • Facebook
  • Reddit
  • Pinterest
  • Email

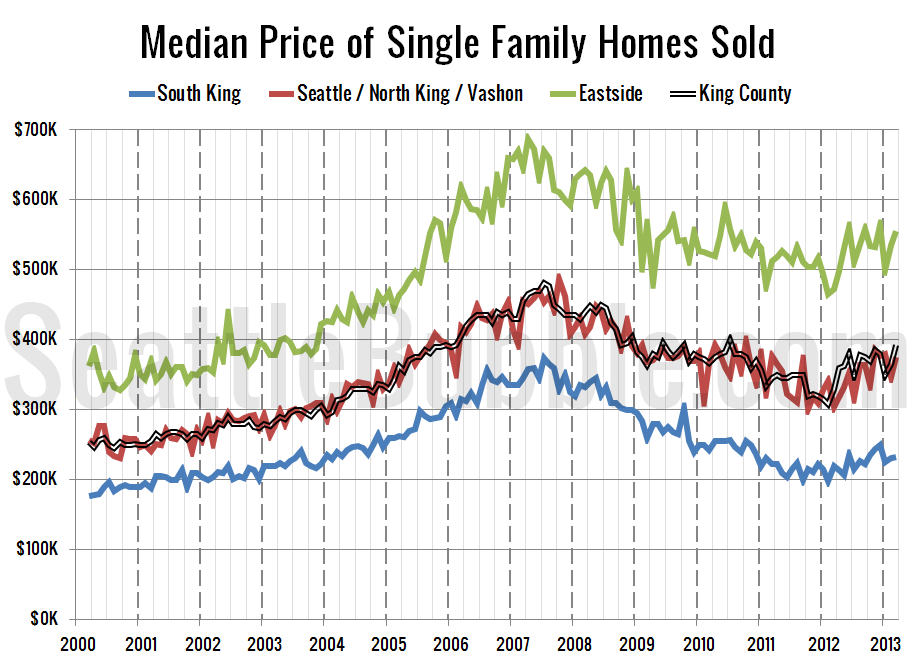
South King and Eastside Sales Neck and Neck

Posted on April 18, 2013 by The Tim

Let’s take an updated look at how King County’s sales are shifting between the different regions around the county, since geographic shifts can and do affect the median price. In order to explore this concept, we break King County down into three regions, based on the NWMLS-defined “areas”: low end: South County (areas 100-130 &…

Share:

  • Twitter
  • LinkedIn
  • Facebook
  • Reddit
  • Pinterest
  • Email

Posts navigation

  • Previous
  • 1
  • …
  • 150
  • 151
  • 152
  • 153
  • 154
  • 155
  • 156
  • …
  • 717
  • Next

Tim’s Other Projects

Dispatches from the Multiverse

Current Market Stats

Charts courtesy Altos Research
Real Estate Market Chart by Altos Research www.altosresearch.com

Real Estate Market Chart by Altos Research www.altosresearch.com

Real Estate Market Chart by Altos Research www.altosresearch.com

Real Estate Market Chart by Altos Research www.altosresearch.com

News Categories

  • News (1,253)
    • Local (223)
    • National (46)
    • International (1)
    • Audio & Video (60)
    • Humor (43)
    • Opinion (88)
    • Uncategorized (314)
  • Features (558)
  • Statistics (1,109)
    • Counties (724)
    • Neighborhoods (100)
  • Economy (74)
  • Extras (491)
    • Polls (381)
    • Flickr Group (1)
    • Announcements (38)
    • Administrative (78)

Archives

Tip Jar

Like what we're doing?

Drop us a tip!

Accounts

  • Log in
  • Entries feed
  • Comments feed
  • WordPress.org
©2024 Seattle Bubble | Built using WordPress and Responsive Blogily theme by Superb