Skip to content

Seattle Bubble

local real estate news, statistics, and commentary without the sales spin.

Menu
  • Home
  • About
  • Contact
  • Reference
  • Speaking
Menu

NWMLS: Listings drought intensifies, months of supply hits a new record low in December

Posted on January 5, 2018 by The Tim

December market stats have been published by the NWMLS. Here’s a quick excerpt from their press release:

“Exceptionally Low” Inventory Slows Year-End Home Sales, Contributes to Steep Price Hikes around Greater Seattle region

…

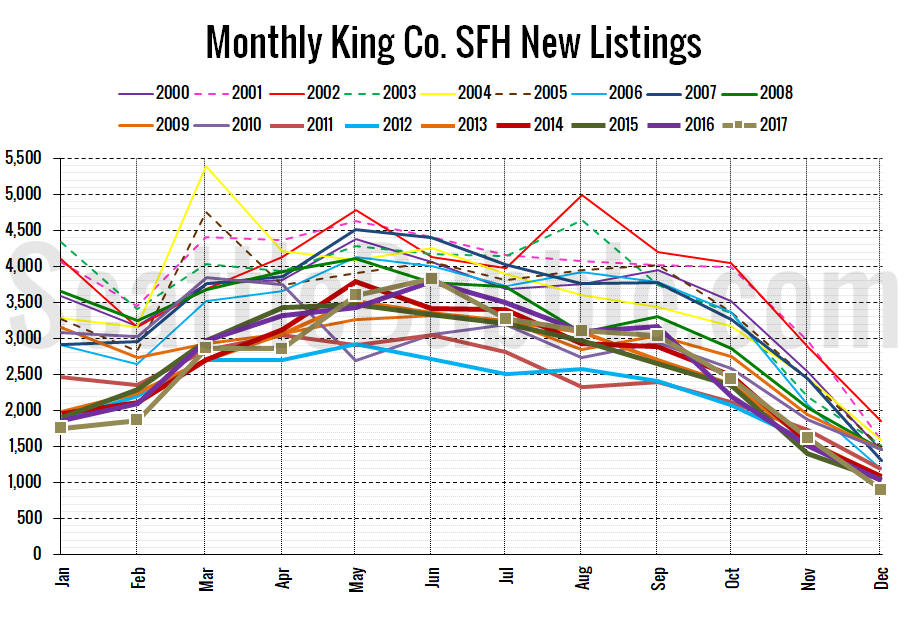
This is the lowest level on record (going back to 2000) for months of supply. The previous record low was December 2016 at 0.76, and the record low before that was December 2015 at 0.86. Supply and demand have never been as far out of balance in the Seattle area as they are right now…
Share:

  • Twitter
  • LinkedIn
  • Facebook
  • Reddit
  • Pinterest
  • Email

December Stats Preview: For-sale inventory hit an all-time low

Posted on January 2, 2018 by The Tim

With the close of December, all of 2017 is now in the books. Today we’ll look at our regular monthly “preview” charts, and the rest of this month we’ll update as many of our stats as possible to look at how the whole of 2017 played out.

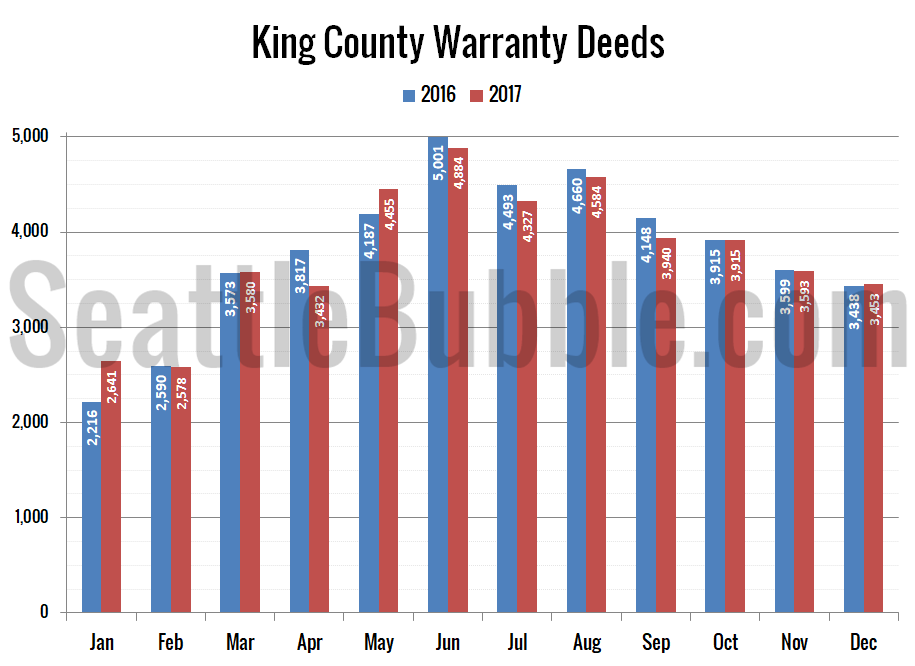
Short story for December: Inventory hit a new all-time low point in both counties. Foreclosures are still basically zero, and sales were surprisingly strong given how low the inventory is.

Here’s the snapshot of all the data as far back as my historical information goes, with the latest, high, and low values highlighted for each series…

Share:

  • Twitter
  • LinkedIn
  • Facebook
  • Reddit
  • Pinterest
  • Email

Case-Shiller: Seattle home prices edged down just barely in October

Posted on December 29, 2017 by The Tim

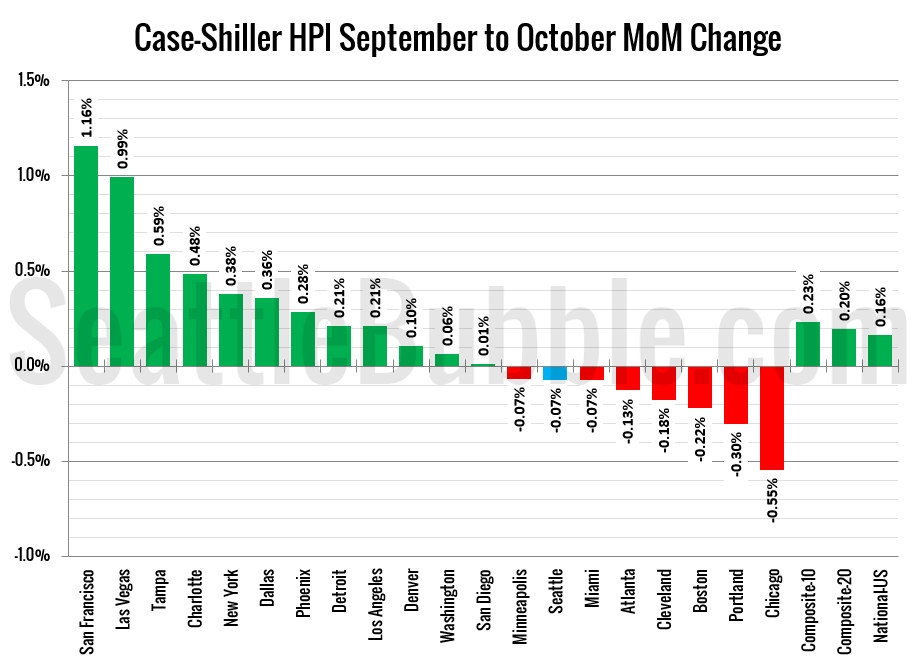
Let’s have a look at the latest data from the Case-Shiller Home Price Index. According to October data that was released this week, Seattle-area home prices were:

Down 0.1 percent September to October
Up 12.7 percent year-over-year.
Up 20.0 percent from the July 2007 peak

Over the same period last year prices were up 0.1 percent month-over-month and year-over-year prices were up 10.6 percent.

Seattle still has by far the largest year-over-year price growth, despite falling off just slightly in each of the last three months of data. The only other city with double-digit price growth from a year earlier is Las Vegas at 10.2 percent.

Share:

  • Twitter
  • LinkedIn
  • Facebook
  • Reddit
  • Pinterest
  • Email

Will the new tax laws slow Seattle’s housing market? (Part 2: New deduction limits)

Posted on December 22, 2017 by The Tim

Let’s finish off our discussion of how the Seattle-area real estate market may be affected next year by the changes to the tax code. In yesterday’s post we discussed the doubling of the standard deduction, and concluded that it is likely to have very little effect. Today let’s look at the other two big changes: The reduction of the mortgage interest deduction cap from $1M to $750k and the capping of local sales, income, and property tax deductions at $10k…

Share:

  • Twitter
  • LinkedIn
  • Facebook
  • Reddit
  • Pinterest
  • Email
Income Taxes Paid by Home Price

Will the new tax laws slow Seattle’s housing market? (Part 1: Doubled Standard Deduction)

Posted on December 21, 2017December 21, 2017 by The Tim

Now that the big GOP tax plan has passed, let’s have a look at how it may affect the Seattle-area real estate market next year when it goes into effect.

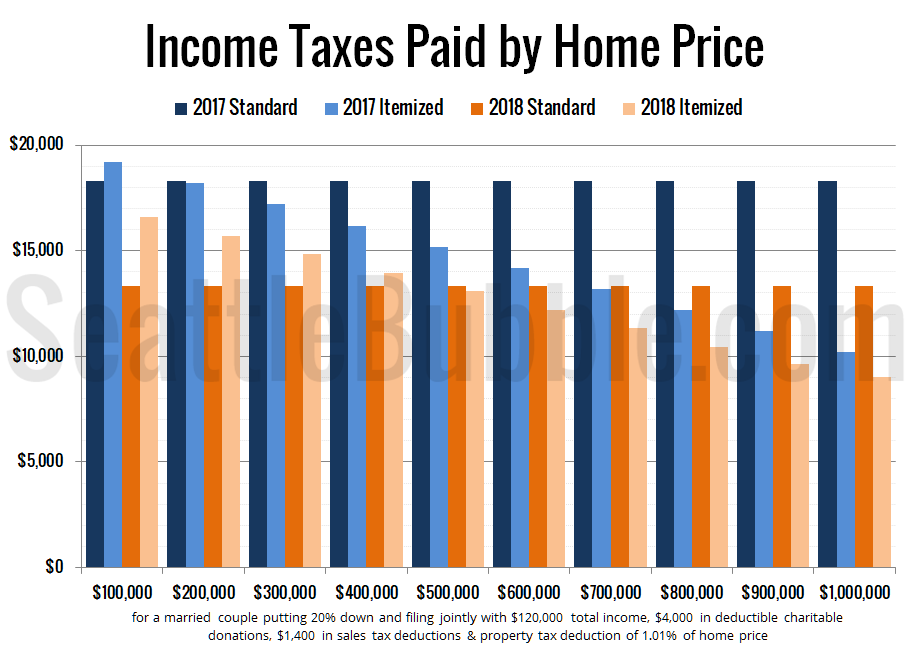
There are two major changes to the tax code that will matter to home buyers and home owners: the doubling of the standard deduction (from $12,700 for a married couple in 2017 to $24,000 in 2018) and the reduction of the mortgage interest deduction cap from $1 million to $750k.

First up let’s look at the doubling of the standard deduction…

Share:

  • Twitter
  • LinkedIn
  • Facebook
  • Reddit
  • Pinterest
  • Email

Posts navigation

  • Previous
  • 1
  • …
  • 15
  • 16
  • 17
  • 18
  • 19
  • 20
  • 21
  • …
  • 717
  • Next

Tim’s Other Projects

Dispatches from the Multiverse

Current Market Stats

Charts courtesy Altos Research
Real Estate Market Chart by Altos Research www.altosresearch.com

Real Estate Market Chart by Altos Research www.altosresearch.com

Real Estate Market Chart by Altos Research www.altosresearch.com

Real Estate Market Chart by Altos Research www.altosresearch.com

News Categories

  • News (1,253)
    • Local (223)
    • National (46)
    • International (1)
    • Audio & Video (60)
    • Humor (43)
    • Opinion (88)
    • Uncategorized (314)
  • Features (558)
  • Statistics (1,109)
    • Counties (724)
    • Neighborhoods (100)
  • Economy (74)
  • Extras (491)
    • Polls (381)
    • Flickr Group (1)
    • Announcements (38)
    • Administrative (78)

Archives

Tip Jar

Like what we're doing?

Drop us a tip!

Accounts

  • Log in
  • Entries feed
  • Comments feed
  • WordPress.org
©2024 Seattle Bubble | Built using WordPress and Responsive Blogily theme by Superb
Menu
  • Home
  • About
  • Contact
  • Reference
  • Speaking